Create a Path for Extracting Data
-
From the Extract-Linearize dialog, click the Add new
Path icon to add a new Path to the table.
Warning: Whenever a new Path is added to the Path table/list, a warning icon will also be displayed in the table which indicates that it has not yet been defined.
-
Select the start node of the Path using one of the following methods.
- Click the Node input collector and select By ID.
- Pick an individual node directly from the model in the modeling window.
-
Select the end node of the Path using one of the following methods.
- Click the Node input collector and select By ID.
- Pick an individual node directly from the model in the modeling window.
Note: Once the start and end nodes have been picked, a green check mark will be displayed in the Path table/list indicating that the Path has now been defined.Tip: The Label, Num. Points, Review, and Color fields are editable. See the Manage a Path topic for additional information. -
The Calculation portion of the tab is for information purposes only to indicate
that the displayed contour will be used for extracting data.
Note: All relevant contour panel settings are considered when extracting data.
-
From the Plot portion of the tab, choose the layout for plotting the data in
HyperGraph.
Option Description One plot per line Creates one HyperGraph window for each selected Path. One plot for all lines Creates one HyperGraph window for all selected Paths. Preview Plot Displays the plots for all selected Paths in a preview window. - Optional:
Save extracted data in the form of a report by activating the check box and
browsing to the location that you would like to save the
.csv file.
The report is divided into five sections and contains the following information:
- The model and result file that was used.
- The line start and end node coordinates, contour settings, and the subcase/simulation step on which the calculation was performed.
- A table showing the distance of each point from the start point in the first column and the extracted contour data in the second columns.
-
Click Apply.
One curve per path is generated in the case of extract data method. In addition a report is created if the Save Report option is selected.
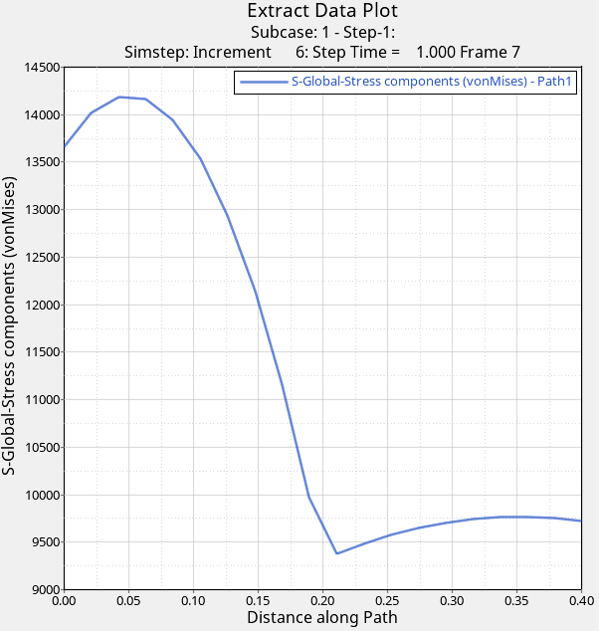
Figure 1.Note: Click the X (located at the top of the tab) to close the dialog.