View Results in a Summary Table
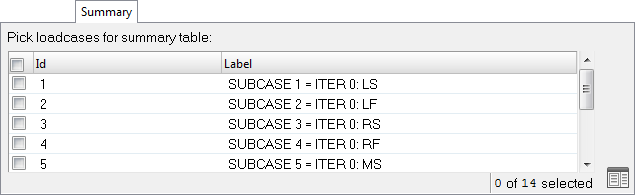
Figure 1.
-
Click the FBD summary table icon
 , located in the lower right
corner of the tab, to output the results to a pop-up dialog for instant
review.
The table contains information about the load cases, element/node sections, and detailed data from the grid point extraction at each node. A sample window with partial output is shown below:
, located in the lower right
corner of the tab, to output the results to a pop-up dialog for instant
review.
The table contains information about the load cases, element/node sections, and detailed data from the grid point extraction at each node. A sample window with partial output is shown below: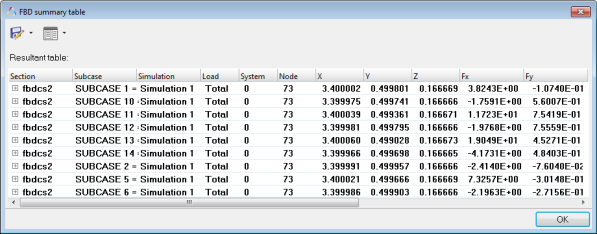 The FBD summary table dialog displays a hierarchical view of the information contained in the FDB tab, grouped together in a table by section and subcase.Note: The table can be sorted by clicking on any of the column headers (Section, Subcase, Simulation, Load, System, Node, X, Y, Z, Fx, Fy, Fz, Mx, My, Mz, Fr, Mr). The sorting method will depend on the type of table that is currently selected.
 - Optional:
Select/change the table type by clicking the drop-down menu
 and selecting one of the
following options:
and selecting one of the
following options:
Option Description Resultant table Displays the information grouped by section/block. Column header sorting will sort the information for each subcase individually.
The top row represents the summation of forces/moments for the section.
Click the plus icon in the Section column to expand and view the information for each subcase.
In the case of FBD plot resolved in Analysis system, the top row is left blank because individual nodes of a section could have results in different systems.
FBD table Displays the information in a flat list, without any grouping by section. Column header sorting will sort the information for the entire list.
Summary table Displays the information for the top level summary rows only. Column header sorting will sort the information for only the summary rows.