Contour Measure Curves
The Contour Measure Curves dialog allows you to quickly plot contour measure curves.
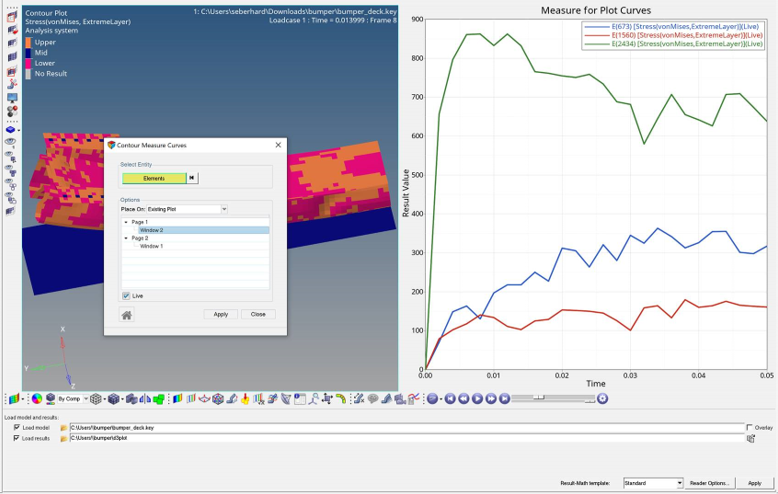
Figure 1.
-
From the Tools men, select Contour Measure Curve.
The Contour Measure Curves dialog is displayed.Note:
- A contour result must be loaded in the active window to allow the tool to start.
- Overlaid models are not supported, a message will be displayed.
- Ensight models with active section cuts and system based results are not supported.
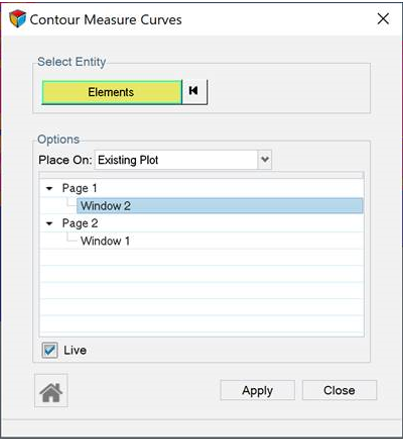
Figure 2. -
Select entities from the modeling window. The entity selector shows the entity
type binding from the loaded contour results (Nodes, Elements,
Components).
Note: Click the Nodes/Elements/Components button on the input collector to access the extended selection menu.
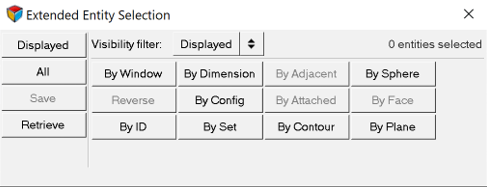
Figure 3. -
After plotting the measure curves, the Home Button
 in the lower left corner of the dialog becomes
active. This button allows you to quickly make the page and HyperView window active where the curves are originated
from and plot additional curves.
in the lower left corner of the dialog becomes
active. This button allows you to quickly make the page and HyperView window active where the curves are originated
from and plot additional curves.