The n-Post event is useful in the correlation process to
ensure the virtual model produces valid results. Using the road profiles from the proving
ground as an input to the simulation and defining the necessary outputs for loads or
accelerations, the fidelity of the virtual model can be established by comparing results from
measurement and simulation. The correlated model can then be used to perform durability and
fatigue tests. The post processing of the results is possible using the Altair product,
HyperLife. The steps involved in the process are described in
the following tutorial.
At present, the following outputs can be generated using the results from the
simulation:
Damage and Life contours
Damage and Rainflow matrix
Range pair damage
Pseudo damage
The first two result pairs (the damage and life contours and damage and rainflow
matrix) can be calculated only for flexible components.
Apart from the predefined
outputs, other outputs that are of interest can also be created within MotionView.
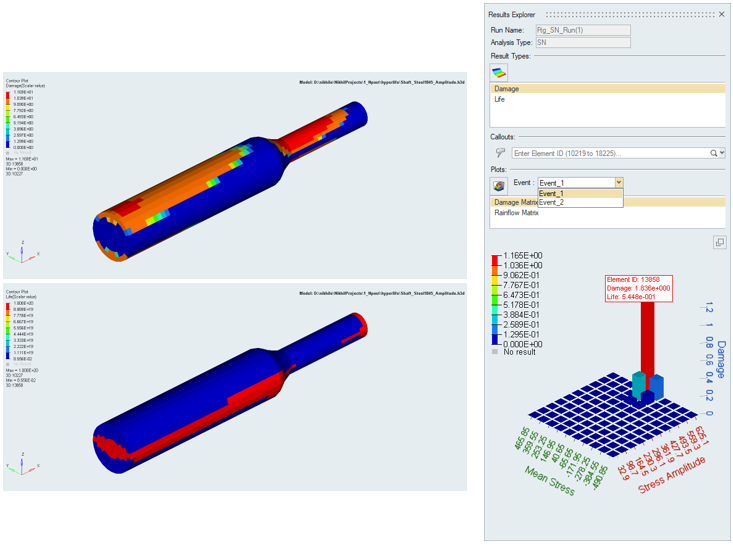
Life Contour
The contour plot for Life shows the
available life for the given fatigue analysis. It represents the number of cycles until the
part will experience failure due to fatigue.
Damage Contour
The contour plot of the damage is
calculated for a given design life. The damage is the design life divided by the available
life. When the damage values calculated are greater than 1, it is an indication of failure
before the design life is reached.
The Rainflow Matrix and the Damage Matrix may be used in
the case of variable amplitude fatigue analysis. In a variable amplitude loading history,
equivalent constant amplitude cycles must be identified. The fatigue damage for all the
cycles in the loading history are summed to obtain the damage for the entire loading
history. Figure 1.