Transfer Path Analysis - Study
Perform a Partial sum, Modify path, Path overlay, or Randomization response study.
To enable this option, you must first plot the path contribution curves.
- Subcase
- Study path contribution by
- Select a subcase to study from the drop-down menu.
- Frequency range
- Indicates the available range, based on the frequencies your TPA has performed.
- Type
- The type of response study.
- Partial sum
- Select path contributions to exclude from the TPA response, with an optional percentage to exclude.
- Modify path
- Activate path modifications from the Path details dialog, and overlay the TPA response from the modified path with the original TPA response.
- Path overlay
- Select specific path contribution curves to overlay with the TPA response.
- Randomization
- Select the paths for randomization.
- % to Exclude
- Optional field that allows you to exclude a percentage of the path contributions from the TPA response.
- Randomization Options
- These options are active only when the Randomization option is chosen from the Type drop-down menu. You can enter the number of randomization runs as well as the magnitude and phase for the randomization of selected paths.
- Select contrib. to:
- Select the path contributions that you want to exclude or include in the response study.
- Sum selection to one contributor
- Sums selected contributors into one contributor for overlay. Only available for Path overlay study.
- Show difference curve as
- Shows a difference curve between the original TPA response and the
Partial sum or the Modified path TPA response curves.
- % of response
- Difference curve shows the difference as a percentage of the original TPA response.
- Scale same as response
- Difference curve shows the difference using the same scale as used in the response plot.
- Display Options
- Launches the Display Options dialog, which allows you to further customize the plot.
- Display
- Displays the response study plot once your selections are complete.
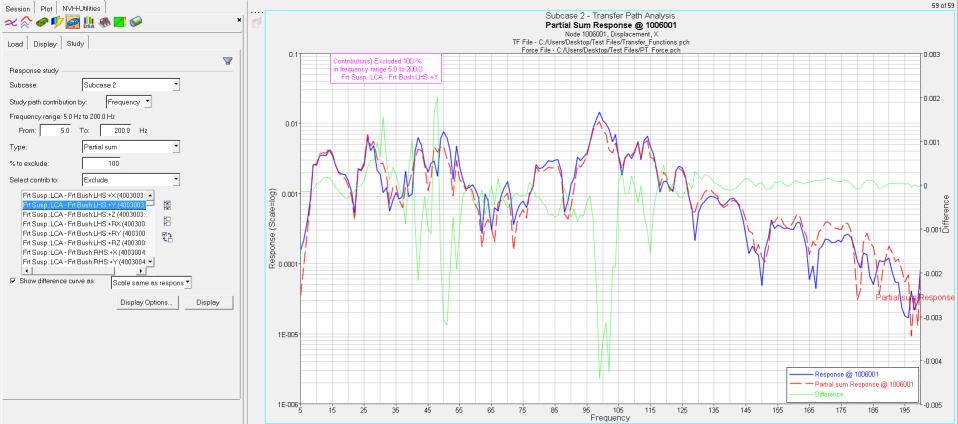
Figure 1. Partial sum plot
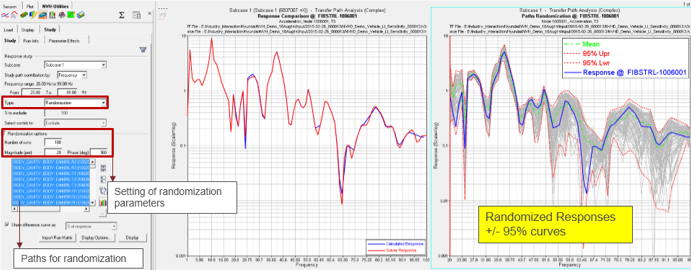
Figure 2. Randomization