Potato Plot
Automatically generates potato plots for subcase screening.
A potato plot uses the *.fbd file from the Resultant Force and Moment (RF&M) utility as its input file. You can select the sections and loadsteps from the *.fbd file to include in the plot, as well as several other plot options described below.
Load File
Click the file open icon, ![]() ,
in the .fbd field to select the path and name of the RF&M
utility's FBD file that contains the data to generate the plot.
,
in the .fbd field to select the path and name of the RF&M
utility's FBD file that contains the data to generate the plot.
Sections
Displays all cross-sections available in the selected FBD file. The Sections selector allows you to specify which cross-sections in the selected FBD file to include in the plot. Multiple cross-sections can be selected using the standard Ctrl/Shift functionality.
-

- Search for a particular filename.
-

- Select all sections or subcases listed.
-

- Exchanges the currently selected items for the unselected items in the list.
-

- Deselects all selected items.
Loadsteps
Lists all loadsteps available in the selected FBD file. The loadstep selector allows you to specify which loadsteps in the selected FBD file to include in the plot. Multiple cross-sections can be selected using the standard Ctrl/Shift functionality.
The Loadsteps filter buttons allow for additional selection methods (see above).
Potato Plots
- X component and Y component
- Each plot is defined by selecting one X and one Y component and by clicking Add plot. Available X and Y components include Fx, Fy, Fz, Mx, My, Mz, Fr, and Mr. Any plots created are added to the table on the right.
- Delete plot
- To delete a plot, highlight one or more plots in the table and click Delete plot.
Plot Titles
Define a title and subtitle for all generated plots.
Plot Options
- Reverse sign
- Allows you to reverse the sign (+/-) of the output at one or more cross-sections. The top drop-down menu is populated with the list of selected cross-sections.
- Reverse Types
- The bottom drop-down menu lists the type of reverse to be performed.
Options include:
- Reverse selected section
- Reverses the sign of the output at only the selected section.
- Reverse all but selected section
- Reverses the sign of the output at all sections but the selected one.
- Reverse all
- Reverses the output at all sections.
- Reverse none
- Does not reverse any data.
- Plot points
- Currently, all interior and boundary points are plotted. Future releases will enable all options.
- Label points
- Allows you choose how to label each point in the plot. Options include:
- Label points (Name)
- Labels each point with the name of the subcase from which it's generated.
- Label points (ID)
- Labels each point with the ID of the subcase from which it's generated.
Note: If both options are selected, the format defaults Name (ID).
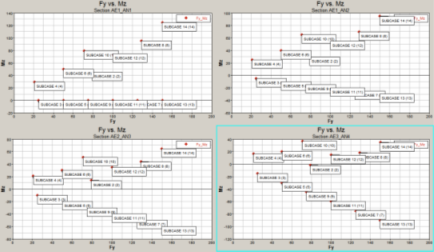
Figure 1. Sample output for Fy vs Mz for four cross-sections. Both the Label points (Name) and Label points (ID) options are selected.