HyperGraph 2D Context Sensitive Menus

From the HyperGraph 2D modeling window, right-click to display the HyperGraph 2D context-sensitive menu.

Plot Window

HG Apply Style
Displays the Style Sheets dialog. From this dialog, you can select and apply attributes of the current plot to either every plot on every page or to every plot on the current page. This option is also accessible from the Tools menu.
New
When you select New from the context sensitive menu, a secondary menu is displayed that contains the following options:
Plots from File
Create multiple curves and plots from a data file. Provides a file selection dialog, then loads the file in the Build Plots panel.
Math Curve
Creates a new math curve in the Define Curves panel.
File Curve
Displays a file selection dialog, then creates a curve associated with the file in the Define Curves panel.
Note
Adds a new note to the plot and opens the Notes panel.
Datum Line - Horizontal
Adds a horizontal datum line and displays the Datum Lines panel.
Datum Line - Vertical
Adds a horizontal datum line and displays the Datum Lines panel.
Y Axis
Adds a new Y axis and displays the Axes panel. This is only available for XY plots and bar charts.
X Axis
Adds a new X axis and displays the Axes panel. This is only available for XY plots.
Switch to Real/Imaginary and Switch to Phase/Magnitude
If the plot type is set to Complex Plot, this option allows you to toggle between the real/imaginary and phase/magnitude axes.
Swap Complex Axes Position
If the plot type is set to Complex Plot, this option allows you to switch the position of the complex axes from top to bottom.
Custom Rendering
If XY Plot is selected, select Gauge from the Custom Rendering menu to display your plot as a gauge plot type. If Bar Chart is selected, select Pie Chart.
Select None to turn off custom rendering.

Curve

View Dependencies
Right-click on a curve and select View Dependencies to display the View Dependencies dialog. This dialog allows you to review the source for the x and y vectors of the current curve, as well as the source for any other vector involved in their definition. You can modify the base file used for the curve, as well as the Type, Request, or Component.
Highlight Source Entity in Model
If a HyperView window is open and on the same page as the HyperGraph 2D window, and you select Highlight Source Entity in Model from the context sensitive curve menu, the node or element is selected on the HyperView animation file.
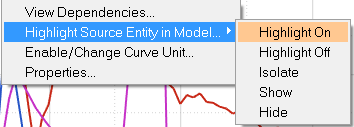

Figure 1.
The following sub-menu options are available:
Highlight on
Displays the label in HyperView for the corresponding entity in HyperGraph
Highlight off
Turns off the display of all highlighted entity labels in HyperView.
Isolate
Turns off everything in HyperView and displays only the selected entity in HyperGraph.
Show
Adds to display in HyperView for the corresponding entity in HyperGraph.
Hide
Hides the source entity.
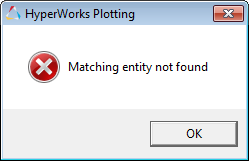
Supported files for Dyna in both ASCII and binary format output include the following:
  • Matsum
  • Nodout
  • Deforc
  • Elout
  • Rbdout
  • Sbtout
  • Swforc
The context sensitive menu is displayed for any curve that is in HyperGraph. However, the menu options for this feature only work for the above file types. For the unsupported files, the following message is displayed.


Figure 2.
Enable/Change Curve Unit
Displays the Enable/Change Curve Unit dialog, which allows you to select a new unit type for the x and y vectors.
Properties
Displays a micro dialog for the curve properties, which allows you to change the line style, size, and color, as well as edit the data symbol type and increment.
Filter, Math, and Injury
If the Vehicle Safety Tools preference files is loaded, or a curve contains vehicle safety information, the Filter, Math, and Injury menu items are displayed.

Axis

New Axis
Right-click on any plot axis and select New Axis from the mouse menu. A new axis is added to the plot and the Axes panel is displayed.
Properties
Displays a micro dialog for the axis properties, which allows you to change the axis color, label, label and tic font, and set the fixed range.
Convert Units
Besides the viewing controls, you can also access the Convert Units option from the plot mouse menu. Right-click on any plot axis to display the menu option. When you select Convert Units, the Convert Axis Units dialog is displayed. You can use this dialog to convert the current axis unit of measure to another unit of measure. The application automatically selects the current axis unit of measure on the Convert Axis Units dialog. From one of the drop-down menus, select the new axis unit of measure to which you want to convert the current axis unit of measure. If the application cannot detect the current axis unit of measure, it automatically defaults to Time.

Context Menus

You can customize the plot context sensitive menu by adding context menu items. These menu items act as a shortcut to options that are also accessible from the menu bar. The menu items are also linked to a particular Tcl/Tk script. See *ContextMenuItem() for more information.

Additional View Controls

Additional viewing controls can be assigned to the left-mouse button in HyperGraph 2D. The view control assigned to the left mouse button is selected from a pop-up menu that is activated by right-clicking. Any one of the view controls can be assigned to the left mouse button. The default setting is Circle Zoom. Right-click in HyperGraph 2D to activate the pop-up menu.
Circle Zoom
Magnifies a selected section of your plot and is the default setting for MB2.
Pick Center
Repositions the plot in relation to the center of the window. When Pick Center is assigned to MB2, a small white square appears in the center of the window.
Translate
Repositions a plot by dragging the mouse.