Build Plots
Constructs multiple curves and plots from a single data file.
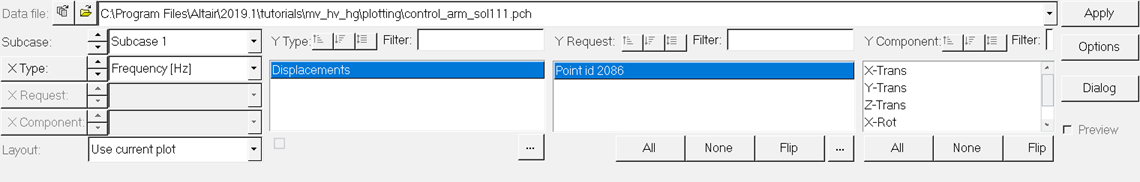
Figure 1.
Open a Plot File
If you know the path and filename of the data file, you can type it directly into the field next to the file folder button and click Apply. The plot file browser can also be used to locate and load a file. To access the file browser, click the file folder button. Click the downward pointing arrow at the far right of the File field to see a list of the most recently loaded files.
- Analysis
- NASTRAN sol 108 and 111
- General
- User-defined import templates and external readers to directly read any file format.
In addition to the standard set of import templates, an open interface for creating custom import filters is provided. Using import language and external readers, you can write import templates for most any ASCII data file not directly supported in the program.
Building Plots with Complex Data Files
- X Type
- Select the data type for the X vectors.
-
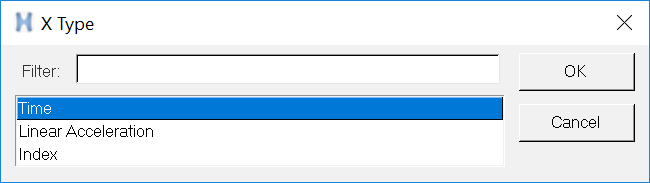
Figure 2. - Y Subcase
- Select the subcase for the Y vectors.
- Y Node
- Multiple nodes can be plotted in the same window, or plotted in
individual windows. The available choices are displayed in a list. The
list can be expanded by clicking the expansion button,
 . Select the request(s).
 - Y Node Filter
- By default, all nodes are shown. To search for a specific node, enter a string and press Enter. Only the nodes that match the string are displayed. The search node feature is case sensitive. To clear a filter, remove the text from the field and press Enter.
- Y Component
- Multiple channels can be plotted in the same window, or plotted in
individual windows. For some data files, each node contains different
channels. Only the channels common to all selected nodes are displayed
in the Y Channel list. The list can be expanded by clicking the
expansion button, . Select the data channel(s).
- Y Component Filter
- By default, all components are shown. To search for a specific component, enter a string and press enter. Only the components that match the string are displayed. The search component feature is case sensitive. To clear a filter, remove the text from the field and press Enter.
- Sorting Type, Requests, and Components
- Click
 to sort the data in ascending order.
 - Click
 to sort the data in descending order.
 - Click
 to return the data list to its original
order.
to return the data list to its original
order.
Building Plots with Nastran Punch Files
HyperGraph 2D is capable of directly reading Nastran punch files for complex displacement and Power Spectral Density (PSD) results in SORT 1 format.
- X, Y Type
- Y Subcase
- A data file consisting of different data types. The available data types depend on the data file.
- X,Y Request
- Y Node
- A data file consisting of different nodes on specific data types.
-
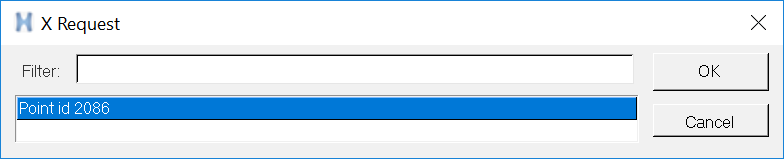
Figure 3. - X,Y Component
- A data file consisting of different results on specific nodes (applies only to PSD results).
-
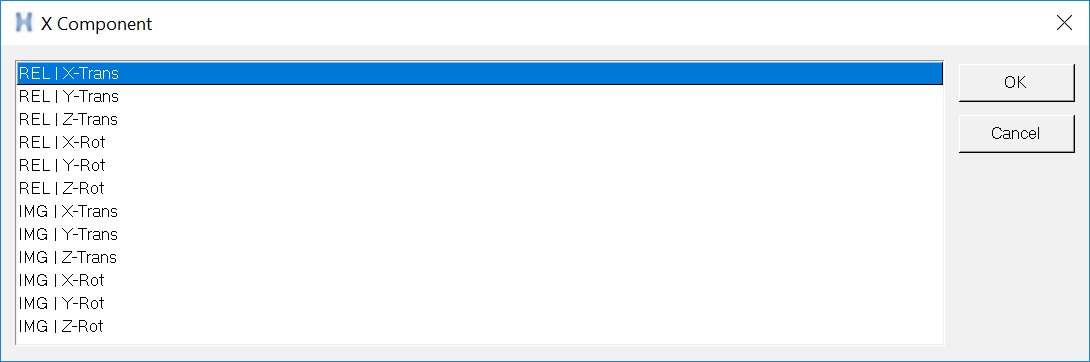
Figure 4.
Multiple Curves
- Use Current Plot
- Every curve is overlaid in the active window. When one of the following options is selected, the page layout icon becomes available.
- One Plot Per Node
- Each selected node is plotted in a new plot with the corresponding channels overlaid.
- One Plot Per Channel
- Each selected NASTRAN channel is plotted in a new plot with the corresponding nodes overlaid.
- One Curve Per Plot
- Each curve is plotted in a new plot.
- Apply
- Click Apply to construct all the curves at once.