Convert SNIR to BER
Convert a SNIR plot to a Bit Error Rate (BER) plot.
Note: This option is only available for network-planning results.
To obtain a BER plot, do the following:
- Display the SNIR plot you wish to convert.
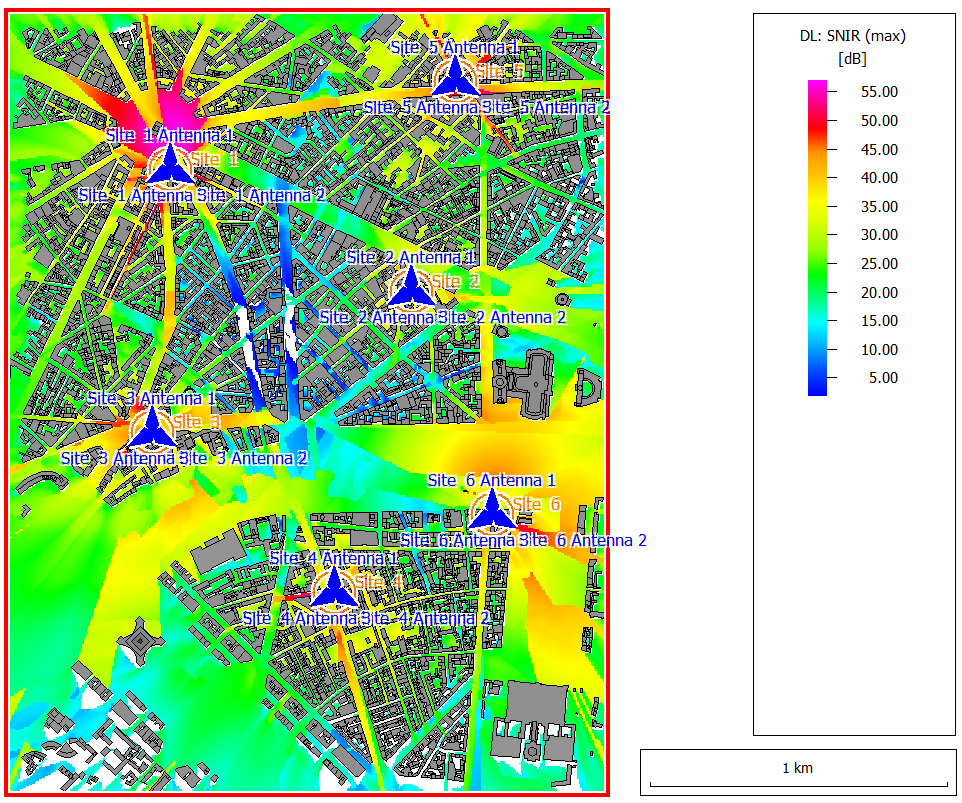
Figure 1. An example of a SNIR plot. - Click .
- Specify a text file that contains two columns with the following information:
- Column 1: SNIR in dB
- Column 2: 10-based log of the corresponding Bit Error Rate
For example:*SNIR [dB] BER log[dB] 0.0 -0.30 5.0 -0.47 11.0 -1.00 15.0 -2.00 18.0 -3.50 20.0 -5.30 21.0 -6.50 22.0 -7.90 23.0 -9.70 24.0 -12.00
For instance, at a SNIR of 21 dB, the Bit Error Rate for this transmission mode is 10-6.5 ≈ 3.2×10⁻⁷. Since the BER curves depend on many parameters, you need to provide the table for the transmission mode of interest.
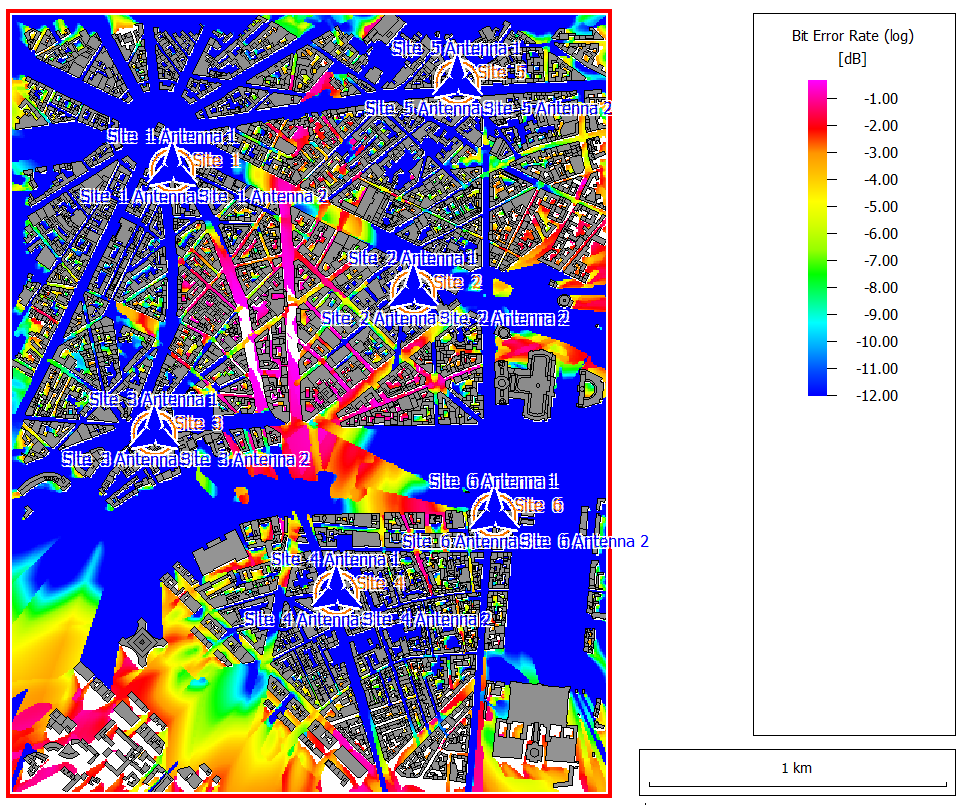
Figure 2. An example of a BER plot (converted from a SNIR plot).