Viewing the Prediction Results
Display the power results using the dominant path model.
-
View the power in the 3D view using the dominant path model
in the urban environment.
-
On the Edit toolbar, click the
 3D View icon.
-
In the tree, expand
 Results: Propagation to view the sites.
-
In the tree, expand
 Site 2 to view the three antennas.
-
In the tree, expand
 Site 2 Antenna 3 to view the
Power.
Site 2 Antenna 3 to view the
Power.
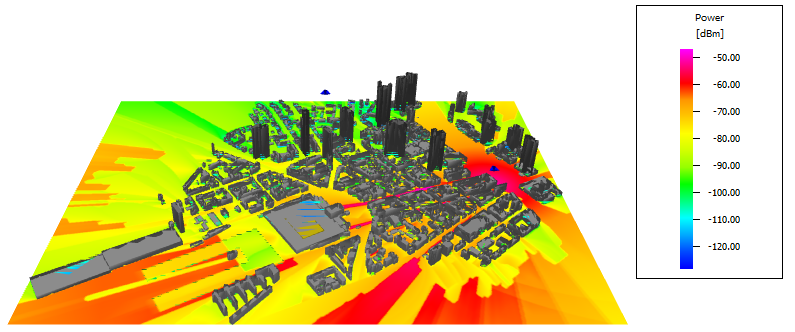
Figure 1. View the power (dBm) in the 3D view.-
Click the
3D View icon again to return to the 2D
view.
-
On the Edit toolbar, click the
-
View the power using the dominant path model in the urban
environment.
-
In the tree, expand
Results: Propagation to view Site 2.
-
In the tree, expand
Site 2 to view the three antennas.
-
In the tree, expand
Site 2 Antenna 3 to view the Field
Strength and Power entries.
-
In the tree, click
 Power to view the results.
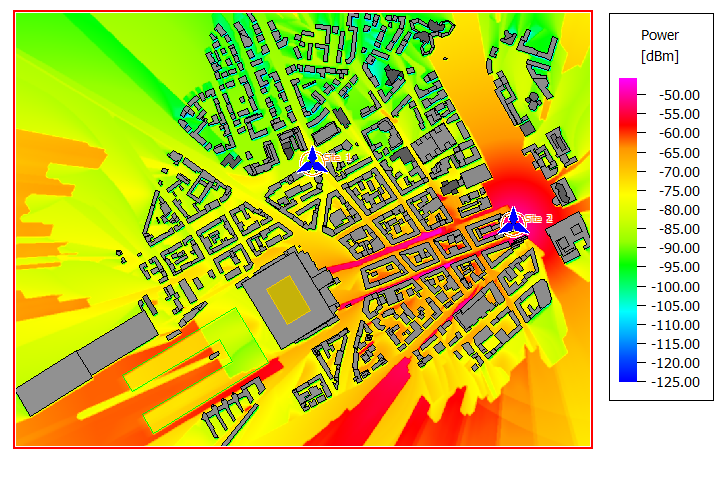
Figure 2. Power calculated for Site 2 Antenna 3 using the dominant path model (DPM).
-
In the tree, expand
-
View the power inside the buildings.
-
Click OK to close the Display
Settings dialog.
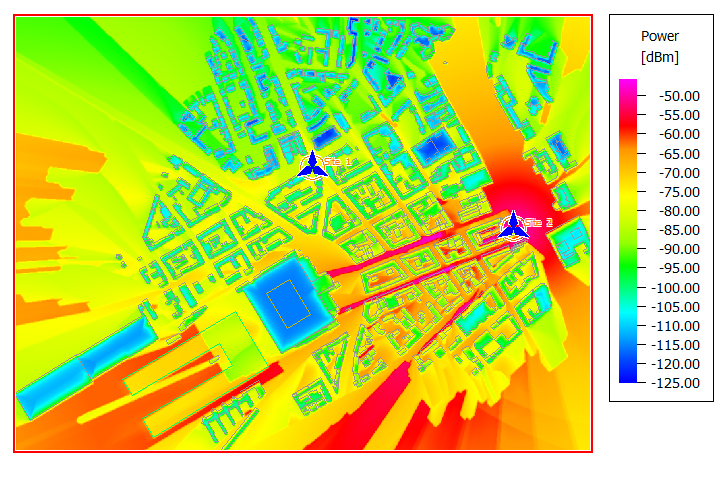
Figure 3. Power calculated for Site 2 Antenna 3 using the dominant path model (DPM). The Fill Buildings display setting is disabled.
-
Click OK to close the Display
Settings dialog.