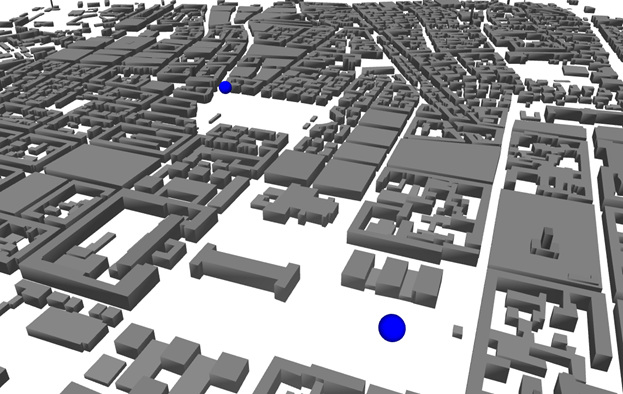
The network planning of an urban scenario is investigated. The geometry is described
by extruded polygons that represent urban buildings.
Figure 1. Geometry for urban communication with 3G network planning project.
Tip: On the Edit toolbar, click the 3D View icon.
Sites and Antennas
There are two omnidirectional (isotropic) antennas placed at different locations (see
the blue dots in Figure 1).
The antennas are installed at the same height and operate on the same carrier
frequency around 2 GHz.
Air Interface
The air interface is defined by a UMTS wireless standard (.wst)
file. CDMA/WCDMA/HSPA (code division multiple access) is selected for multiple
access. The required Channel Bandwidth and Carrier
Separation are added under the Air Interface
tab.
Tip: Click Project > Edit Project Parameter and click the Air Interface tab to view
the carriers and transmission modes.
Computational Method
The computational method used in this model is the dominant path model (DPM). This method DPM focuses on the most
relevant path, which leads to shorter computation times compared to ray tracing.
Tip: Click Project > Edit Project Parameter and click the Computation tab to change
the model.
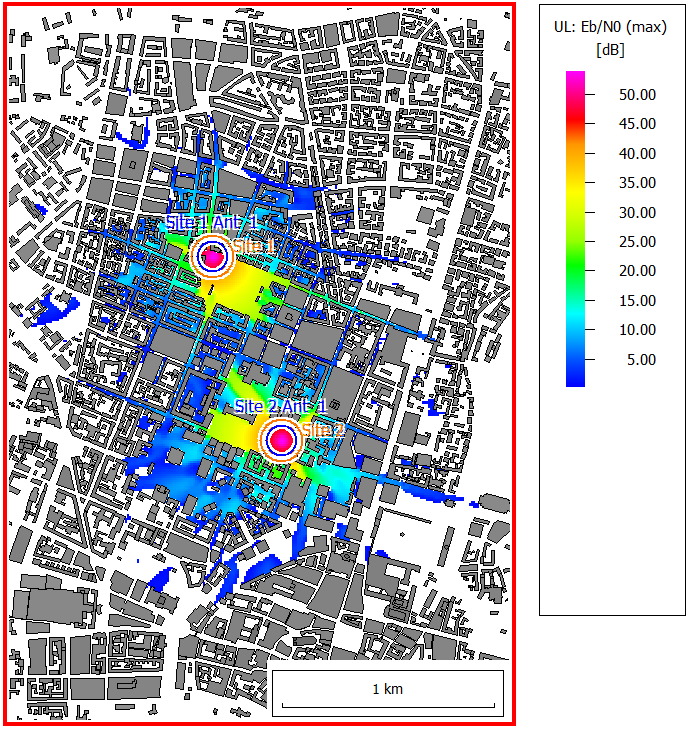
Results
Results are computed for each antenna. Propagation results show the power received by
a hypothetical isotropic receiver from each transmitting antenna at every
location.
The type of network simulation is a static simulation (homogeneous traffic per cell).
Network results in this project include the following for every location:
best server
maximum data rate
maximum throughput
site area
It also calculates the following parameters:
minimum required transmitter power
maximum achievable received signal strength
maximum achievable Eb/N0, maximum achievable
Ec/(N0+I0)
maximum number of parallel streams
The above parameters are computed at each location for all modulation and
coding schemes used in this model, for both downlink and uplink.
White pixels indicate that no communication is possible with the given modulation and
coding scheme. Many pixels remain white in this example, especially with the faster
schemes. Figure 2 shows an
example of a network-planning result.
 3D View icon.