Review Results
In the Results tab, you can review the area-based qualitative results for the comparison.
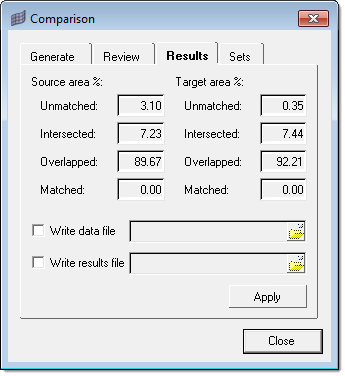
Figure 1.
- Click the Results tab.
-
Review results.
When comparing CAD-CAD or FE-FE, the area percentages are calculated by summing the areas of all the entities in each category and dividing them by the total area. However, when comparing CAD-FE or FE-CAD, the Comparison tool uses the areas of the overlapped and intersected elements in place of the overlapped and intersected surfaces when making these calculations. While this may not be technically correct, it results in more accurate area percentage estimates.
The overlapped and intersected categories are inherently imprecise. The actual lines of intersection between the compared entities seldom lie along the element and surface boundaries and thus cannot be easily determined. If the surfaces and elements were highly refined to a very small scale, you would have no overlapped or intersected entities at all. Instead the elements and surfaces would all be either matched or unmatched and the area percentages could be calculated to a high degree of accuracy. However, since this is not a practical solution, the Comparison Tool tries to get the most accuracy out of the entities you have.
In general, intersections between CAD and FE usually involve only small areas of the model, for example, a hole in the CAD which is not represented in the FE. The Comparison Tool marks the entire surface as a single match type and chooses the most severe type: intersected. This is despite the fact that the majority of the surface may be overlapped with the FE mesh. If the entire surface is used when calculating the area percentage of the intersected surfaces, that figure may end up being misleadingly high since only a small part of the model is actually intersected. Also, the area percentages between the surfaces and the elements may end up being very different due to the relative size differences between the elements and surfaces, which can be confusing. Is the model 5 percent intersected as the elements show or 25 percent intersected as the surfaces indicate? Since elements are generally smaller than surfaces, they generally give a more accurate assessment of the actual amounts of the model which are intersected and overlapped. For this reason, the FE areas are used instead of the surface areas in the area calculations, with care taken to ensure that the percentages all add up to 100 percent. The result is more accurate results and tighter correlation between element and surface area percentages.
-
Export comparison results to external files.
- To write the current comparison data (transformations, match types, match entities, and so on) to a file, select the Write data file checkbox.
- To write the current comparison results (area%, entity groupings) to a file, select the Write results file checkbox.
Both distance and comparison results can also be exported to an .h3d file from the menu bar by clicking File > Export > Model and enabling the Write results checkbox.
For comparison results, the following special behaviors apply:- If the source, target, or both are not transparent, and if a match type is turned off, the entities belonging to that match type will not be exported.
- If the source, target, or both are transparent, all match types are exported regardless of whether they are turned on or off. The components can be made transparent within HyperView or HyperView Player as desired.
- If the transparent color is gray, the entities are shown as "no result" (which is also gray). Otherwise they are shown in color.
- Click Apply.