Setup DDAM Analysis
Setup a DDAM analysis for Abaqus, and use the Shock Spectra curves for a subsequent Response Spectum Analysis.
Before you can setup a DDAM analysis, a normal mode
result must be available for the model. Abaqus
*.dat files are supported.
-
Click Import.
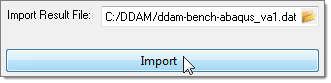
Figure 1. -
Select shock modes for the DDAM process.
-
If you selected Manual, select modes from the table.
Note: By default, modes that have the largest contribution until the minimum cumulative model weight of 80 percent is achieved are selected. These modes are highlighted in grey. By default, these modes are shown for the contribution in the X-Direction.The summation of percent modal weight currently selected is displayed in the the Percent Selected Modal Weight field. Green indicates the percentage is greater than the minimum cumulative modal weight, yellow indicates the percentage is close to the minimum cumulative modal weight, and red indicates more modes are needed.
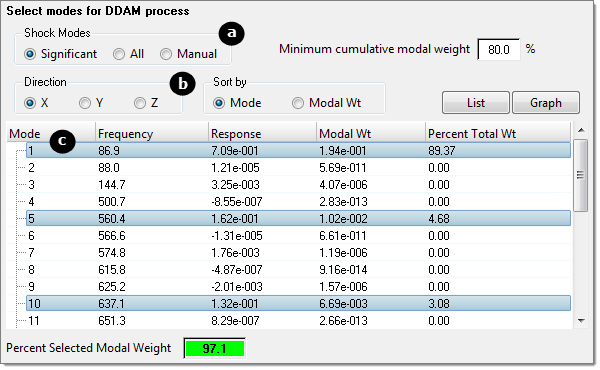
Figure 2.
-
If you selected Manual, select modes from the table.
-
Determine DDAM loading values.
- Select a Ship Type.
- Select a Mounting System.
- Select a Deformation Type.
- To manually define loading values, select Specify values.
Note: By default, the loading values are pre-populated with the NREL 1396 values.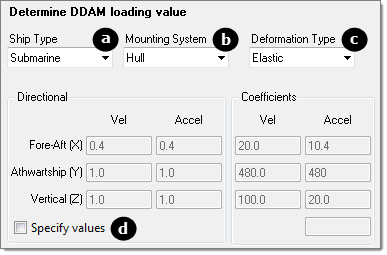
Figure 3. -
Click Calculate Spectrum.
The Shock Spectra curves are calculated, and the mode table and weighted average Da values are populated.
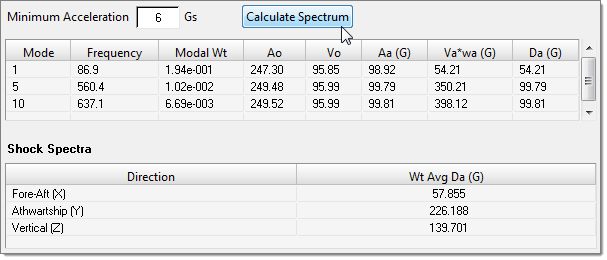
Figure 4. -
View a plot of the Shock Spectra curves.
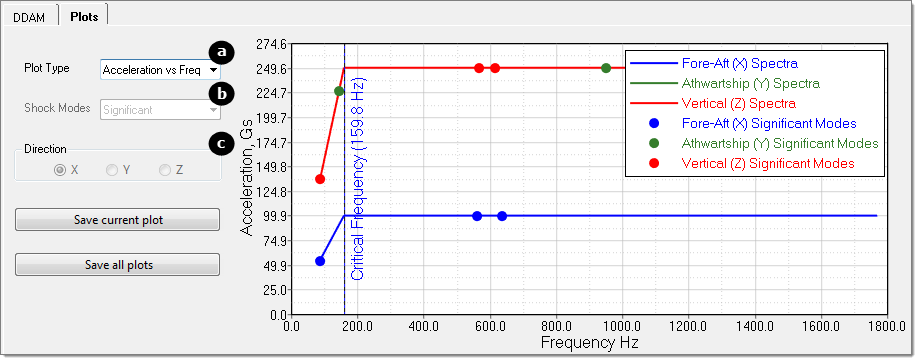
Figure 5.