Use and Understand Timing Output Information
Timing information is not provided by default due to the primary reason that the details are highly verbose.
To obtain timing information, you need to set the environment variable: FV_TIMING = 1.
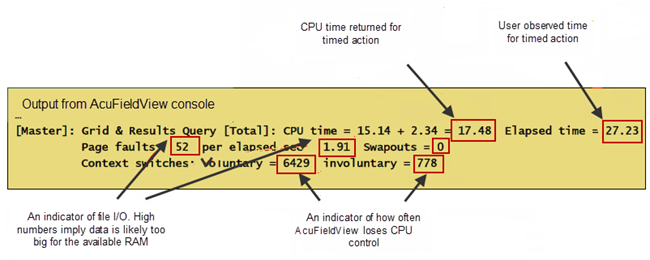
Figure 1.
acuFv -s my_script.scr 2>&1 | tee my.logTIMING ON
RESTART ALL read_only
TIMING OFF OVERALL READ ONLYNote that the AcuFieldView TIMING ON/OFF script command is also used in this example. The resulting timing output (abbreviated and re-arranged here for clarity) is:
[Client]: Grid&Results Query [Total]: CPU time = 0.00 + 0.00 = 0.00 Elapsed time = 0.00
[Client]: Grid&Results Read+Preprocess [Total]: CPU time = 0.00 + 0.00 = 0.00 Elapsed time = 8.25
[Client]: OVERALL READ ONLY: CPU time = 0.21 + 0.12 = 0.33 Elapsed time = 9.39
[Controller]: Grid & Results Query [Total]: CPU time = 0.00 + 0.00 = 0.00 Elapsed time = 0.00
[1]: Grid Preprocess: CPU time = 5.99 + 0.10 = 6.09 Elapsed time = 7.31
[1]: Grid&Results Read+Preprocess: CPU time = 6.12 + 0.20 = 6.32 Elapsed time = 7.60
[1]: Grids have 401646 nodes and 1927829 elements. [2]: Grid Preprocess: CPU time = 5.60 + 0.05 = 5.65 Elapsed time = 6.76
[2]: Grid&Results Read+Preprocess: CPU time = 5.70 + 0.15 = 5.85 Elapsed time = 7.01
[2]: Grids have 367357 nodes and 1927828 elements.
[3]: Grid Preprocess: CPU time = 5.72 + 0.09 = 5.81 Elapsed time = 6.90
[3]: Grid&Results Read+Preprocess: CPU time = 5.87 + 0.17 = 6.04 Elapsed time = 7.27 [3]: Grids have 400686 nodes and 1927828 elements.
[4]: Grid Preprocess: CPU time = 5.48 + 0.05 = 5.53 Elapsed time = 5.53
[4]: Grid&Results Read+Preprocess: CPU time = 5.59 + 0.13 = 5.72 Elapsed time = 5.74
[4]: Grids have 371729 nodes and 1927828 elements.
[5]: Grid Preprocess: CPU time = 5.56 + 0.09 = 5.65 Elapsed time = 6.23
[5]: Grid&Results Read+Preprocess: CPU time = 5.68 + 0.17 = 5.85 Elapsed time = 6.51
[5]: Grids have 369113 nodes and 1927828 elements.
[6]: Grid Preprocess: CPU time = 5.54 + 0.05 = 5.59 Elapsed time = 5.84
[6]: Grid&Results Read+Preprocess: CPU time = 5.65 + 0.14 = 5.79 Elapsed time = 6.09
[6]: Grids have 366739 nodes and 1927828 elements.
[7]: Grid Preprocess: CPU time = 6.11 + 0.08 = 6.19 Elapsed time = 7.35
[7]: Grid&Results Read+Preprocess: CPU time = 6.27 + 0.17 = 6.44 Elapsed time = 7.67
[7]: Grids have 426769 nodes and 1927828 elements.
[8]: Grid Preprocess: CPU time = 6.65 + 0.07 = 6.72 Elapsed time = 7.84
[8]: Grid&Results Read+Preprocess: CPU time = 6.83 + 0.15 = 6.98 Elapsed time = 8.25
[8]: Grids have 452541 nodes and 1927828 elements.
- By comparing the elapsed times for the [Client] for Grid&Results Read+Preprocess [Total] vs OVERALL READ ONLY you see only a very small difference. There does not appear to be a slowdown between the client and the server.
- The Elapsed time for Grid&Results Read+Preprocess for each of the workers appears to be roughly the same, suggesting that the dataset is well balanced across all the worker processes.
- Worker process [8] has the longest elapsed time and is equal to the Elapsed time for the [Client] - this process controls overall level of parallel performance for this data read operation.
In order to test whether there may be problems running across a network, timing results for reading data remotely from a different system, using the same servers as above, have been obtained. The timing results for this operation are presented below:
[Client]: Grid&Results Query [Total]: CPU time = 0.00 + 0.00 = 0.00 Elapsed time = 0.01
[Client]: Grid&Results Read+Preprocess [Total]: CPU time = 0.00 + 0.00 = 0.00 Elapsed time = 8.28
[Client]: OVERALL READ ONLY: CPU time = 0.25 + 0.10 = 0.35 Elapsed time = 9.83
[Controller]: Grid & Results Query [Total]: CPU time = 0.00 + 0.00 = 0.00 Elapsed time = 0.00
[1]: Grid Preprocess: CPU time = 6.10 + 0.08 = 6.18 Elapsed time = 6.93
[1]: Grid&Results Read+Preprocess: CPU time = 6.28 + 0.14 = 6.42 Elapsed time = 7.30
[1]: Grids have 401646 nodes and 1927829 elements. [2]: Grid Preprocess: CPU time = 5.62 + 0.08 = 5.70 Elapsed time = 6.33
[2]: Grid&Results Read+Preprocess: CPU time = 5.76 + 0.14 = 5.90 Elapsed time = 6.76
[2]: Grids have 367357 nodes and 1927828 elements.
[3]: Grid Preprocess: CPU time = 5.79 + 0.06 = 5.85 Elapsed time = 6.46
[3]: Grid&Results Read+Preprocess: CPU time = 5.94 + 0.14 = 6.08 Elapsed time = 6.91
[3]: Grids have 400686 nodes and 1927828 elements.
[4]: Grid Preprocess: CPU time = 5.41 + 0.10 = 5.51 Elapsed time = 6.00
[4]: Grid&Results Read+Preprocess: CPU time = 5.54 + 0.17 = 5.71 Elapsed time = 6.28
[4]: Grids have 371729 nodes and 1927828 elements.
[5]: Grid Preprocess: CPU time = 5.56 + 0.05 = 5.61 Elapsed time = 6.40
[5]: Grid&Results Read+Preprocess: CPU time = 5.71 + 0.11 = 5.82 Elapsed time = 6.67
[5]: Grids have 369113 nodes and 1927828 elements.
[6]: Grid Preprocess: CPU time = 5.52 + 0.10 = 5.62 Elapsed time = 7.28
[6]: Grid&Results Read+Preprocess: CPU time = 5.64 + 0.18 = 5.82 Elapsed time = 7.56
[6]: Grids have 366739 nodes and 1927828 elements.
[7]: Grid Preprocess: CPU time = 6.09 + 0.07 = 6.16 Elapsed time = 7.36
[7]: Grid&Results Read+Preprocess: CPU time = 6.26 + 0.17 = 6.43 Elapsed time = 7.73
[7]: Grids have 426769 nodes and 1927828 elements.
[8]: Grid Preprocess: CPU time = 6.74 + 0.10 = 6.84 Elapsed time = 7.84
[8]: Grid&Results Read+Preprocess: CPU time = 6.90 + 0.23 = 7.13 Elapsed time = 8.28
[8]: Grids have 452541 nodes and 1927828 elements.
From the listing above, you can see that all the Elapsed time results are nearly the same whether you are running locally or remotely. From this, you can conclude that there are no network issues present.