The coupling results are derived from the received power data. In POSTFEKO the
received power may be plotted on a graph. It is also given in the
.out file.
Compute the coupling from the following equation:
(1)
Table 1. Coupling results for the four models at 1.654 GHz
Model
Received power (mW)
Coupling (dB)
Runtime (s)
Full model
3.03
-45.55
100
Far field pattern
2.61
-45.85
<12
Spherical modes
2.62
-45.82
<12
Near field
2.67
-45.74
<12
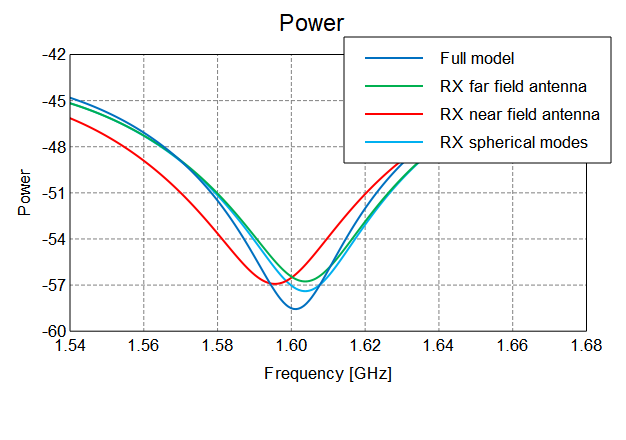
For convenience results were computed over a frequency range and plotted on a
graph in POSTFEKO.
Figure 1. Coupling results over a frequency range for the four models.
Tip: The built-in math of POSTFEKO can be used to manipulate graph
traces. For example to convert the far field receiving antenna power to
coupling in dB, plot the power for the far field receiving antenna, then use
the New math feature of POSTFEKO and enter the
equation 10*log(self/100)