Using the Real-time Dashboard
-
To change the time range for the dashboard select it from the toolbar at the
top.
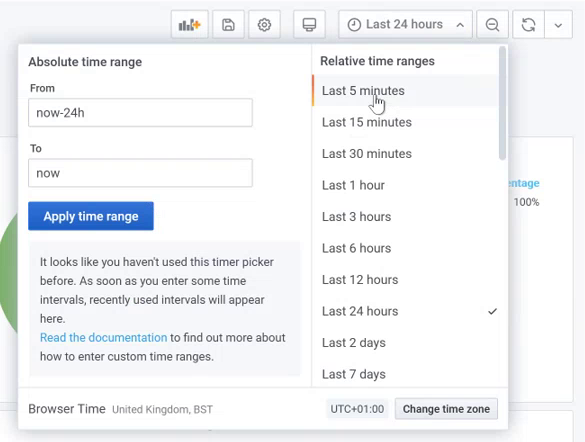
Figure 1. Set Time RangesTo specify a time range choose:- Absolute time range: Specify the From and To time.
- Relative time range: Specify any time range from Last 5 minutes to Last 7 days.
-
Apply filters to the dashboards to monitor the real-time data.

Figure 2. Dashboard FiltersTo filter the dashboard choose:-
filter by job owner : list of job owners is displayed.
-
filter by project: list of projects is displayed.
- filter by queue: list of queues is displayed.
- Group top 10 plot by job_owner, project and queue
- For jobs in state: choose the state of the job.
-