


|
Creating Summaries in Data Prep Studio
A summary tabulates information for selected fields and presents the results in a one or two dimensional matrix. The most basic summary requires a single key field, in this case, a row (if you are a Monarch Classic user, this is a down key), and a single measure. However, you can create summary reports that include multiple key fields and multiple measures. A host of other display options lets you sort the summary, add subtotals, and format your summary report for easier viewing.
To create a basic summary, the following procedure is observed:
These steps are elaborated further below.
Steps:
-
Ensure that the table from which you intend to create a summary is selected in the Prepare window.
-
Click the Analyze tab from the Data Prep Studio toolbar to launch the Summary options.
-
Select
 Add Summary.
The Add Summary dialog displays.
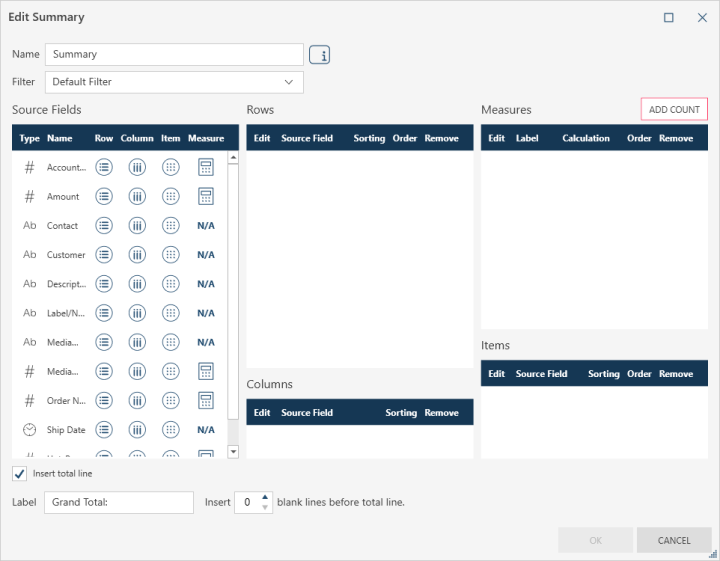
Naming and adding a description of the summary
To provide a meaningful name to your summary, enter a new name into
the Name field located at the upper left-hand corner of the Add Summary
dialog. In this example, let's name the summary Sales
by Customer and Media. To add a description of the summary, click
on the Summary Description  icon located to the right
of the Name field and then add
a relevant entry. Once done, click on the Accept
icon located to the right
of the Name field and then add
a relevant entry. Once done, click on the Accept
 icon to accept and save your
description. Otherwise, click the Cancel
icon to accept and save your
description. Otherwise, click the Cancel
 icon.
icon.
Selecting rows
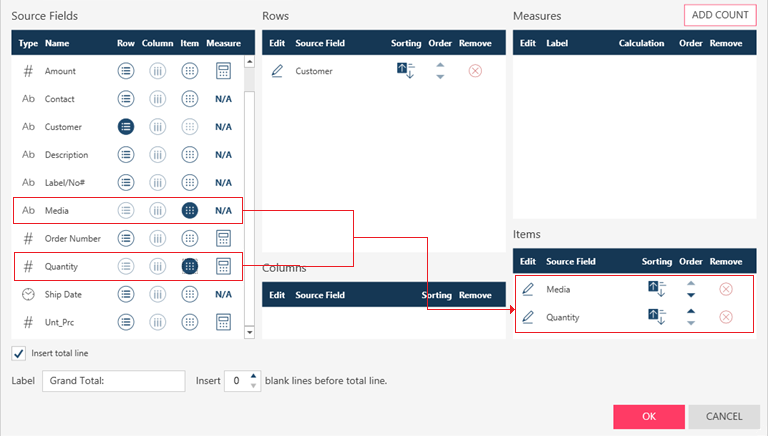
The Source Fields panel of the Add Summary dialog will list all of the columns included in the original table you selected. Beside each field name are icons for rows, columns, and measures. Note that only numeric fields can be used as measures. Click the Row icon of each field you wish to add to your summary as a row. Doing so adds the selected field to the Rows panel located to the right of the Add Summary dialog.
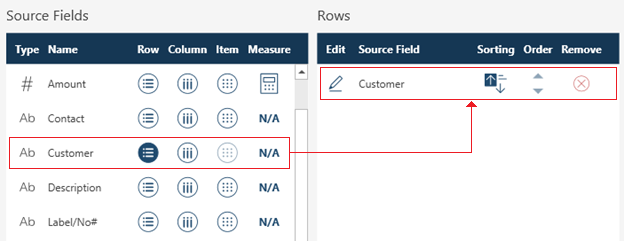
If you have more than one row field selected and would like to change the order in which rows are displayed in your summary, use the Move Up or Move Down icons under the Order column to arrange the rows in the order you wish.
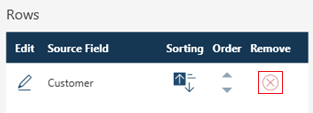
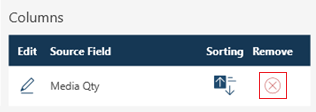
If you change your mind and no longer wish to use the selected field as a row, remove it from the Rows panel by clicking on the Remove icon to its right.
Selecting columns
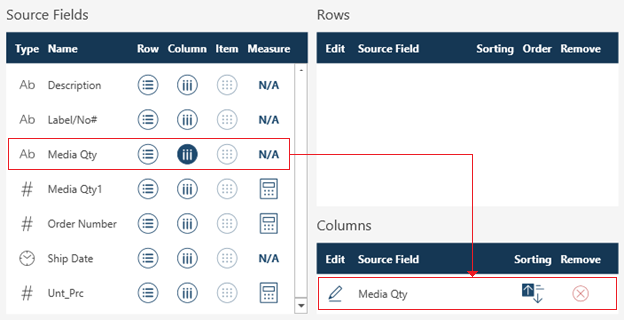
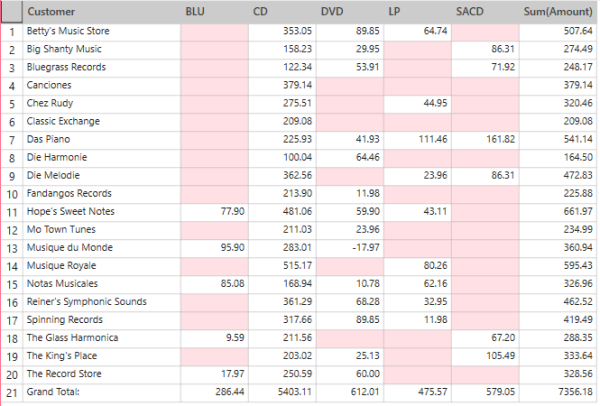
You can add a field to your summary whose values display as columns (if you are a Monarch Classic user, this is an across key). From the Source Fields panel of the Add Summary dialog, click the Column icon of each field you wish to add to your summary as a column. Doing so adds the selected field to the Columns panel located to the right of the Add Summary dialog. Note that you can select only one Column field for each summary. If you select a second column, the first column you added to the Columns panel is replaced. In addition, when a Column field has been defined, you must include at least one measure to the summary. As well, if you add a column to your summary, you can no longer add items to it.
If you change your mind and no longer wish to use the selected field as a column, remove it from the Columns panel by clicking on the Remove icon to its right.
Selecting items
A summary can also include item fields that expand a summary to show individual transactions. Item fields provide an advantage over viewing individual transactions in the Table window because you can use the summary to display subtotals and grand totals. Note that if you add items to your summary, you can no longer add a column to it.
If you change your mind and no longer wish to use the selected field as a column, remove it from the Columns panel by clicking on the Remove icon to its right. If you wish to simply hide an item from the summary but not necessarily delete it, click on the Edit icon to the left of an item field and, in the Item Field Properties dialog that displays, tick the box for Display: Hidden. Click OK on the dialog when you are done and continue creating your summary.
Selecting measures
Measures are fields that can be tabulated or summed. From the Source Fields panel of the Add Summary dialog, click the Measures icon of each field you wish to add to your summary as a measure. Doing so adds the selected field to the Measures panel located to the right of the Add Summary dialog.
If you have more than one measure field selected and would like to change the order in which measures are displayed in your summary, use the Move Up or Move Down icons under the Order column to arrange the measures in the order you wish.
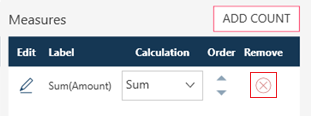
If you change your mind and no longer wish to use the selected field as a measure, remove it from the Measures panel by clicking on the Remove icon to its right.
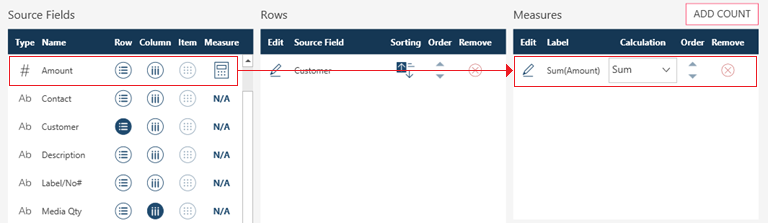
You can add a COUNT field as a measure by clicking the Add Count button located to the right of the Measures panel. The COUNT function tabulates the total number of unique records for a given row. For example, adding a COUNT field as a measure to a summary definition in which Customer is defined as a row and no other field is selected as a column yields the following summary:
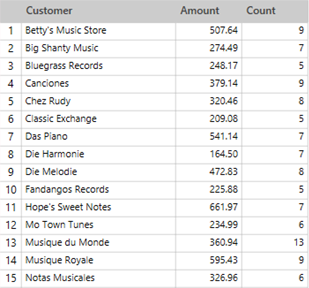
In the example above, 9 unique records were found for Betty's Music Store in the original table. Seven unique records were found for Big Shanty Music, 5 were found for Bluegrass Records, etc.
In the next example, a COUNT field was added to a summary definition in which Customer and Media were defined as a rows.
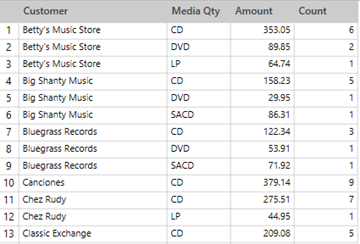
In this case, 6 records were found for Betty's Music Store selling CDs, 2 records were found for the same store selling DVDs, 1 record was found for LP sales, etc.
Assigning a calculation to a measure
A calculation must be assigned to each measure you add to a summary. You can select a calculation for your measure using the Calculation drop-down provided with the Measures panel.
These calculations include:
-
SUM - Returns the sum of the field values.
-
AVG - Returns the average value of the field.
-
MIN - Returns the minimum value of the field.
-
MAX - Displays the maximum value found within all records represented by each key field value.
-
STDEV - Returns the standard deviation of the field values.
-
STDEVP - Returns the standard deviation (with respect to the population) of the field values.
-
VAR - Returns the variance of the field values.
-
VARP - Returns the variance (with respect to the population) of the field values.
-
PCT - Returns the group sum as a percentage of the total sum.
-
SUBPCT - Returns the group sum as a percentage of the group sum of the next larger group.
-
UNIQUE - Returns the unique value of the field if there is a unique value, otherwise returns null.
-
COUNT - Returns the count of rows (or non-null values of the field).
-
COUNTPCT - Returns the group row count as a percentage of total rows.
-
COUNTSUBPCT - Returns the group record count as a percentage of the total record count in the next larger group.
-
CUM - Returns the cumulative sum
-
CUMPCT - Returns the cumulative sum as a percentage of the total sum.
-
CUMCOUNT - Returns the cumulative row count.
-
CUMCOUNTPCT - Returns the cumulative row count as a percentage of the total rows.
For COUNT fields, you can select:
-
COUNT - Returns the count of rows (or non-null values of the field).
-
COUNTPCT - Returns the group row count as a percentage of total rows.
-
COUNTSUBPCT - Returns the group record count as a percentage of the total record count in the next larger group.
-
CUMCOUNT - Returns the cumulative row count.
-
CUMCOUNTPCT - Returns the cumulative row count as a percentage of the total rows.
Selecting a filter to apply to the summary
If you wish to apply a filter to your summary, select this filter from the Filter drop-down list.
Building and displaying the summary
To build and display the summary, click OK. Alternatively, to exit without building the summary, click Cancel.
Monarch Data Prep Studio builds the summary and displays it below the Analyze drop-down.
Related Links