| 1. | In the tree of the Model browser, next to Rigid elements, select  . . |
The display of Rigid elements is turned off in the model graphics.
| 2. | From the animation controls, animate the model and observe the ply behavior. |

| 3. | In the tree of the Model browser, next to the following elements: Resin1, Resin2, Punch, Binder and Die, select . |
The display of the selected elements is turned off in the model graphics. Only the plies are visible.
| 4. | From the toolbar, select  , and the Contour panel appears. , and the Contour panel appears. |
Note that for Result type, the following options are available for multilayer composite forming simulations:
| • | Fiber rotation (derived result) |
| • | Fiber orientation (derived result) |
| • | USR1 = Stresses in fiber1 |
| • | USR2 = Stresses in fiber2 |
| • | USR6 = tangent of shear angle |
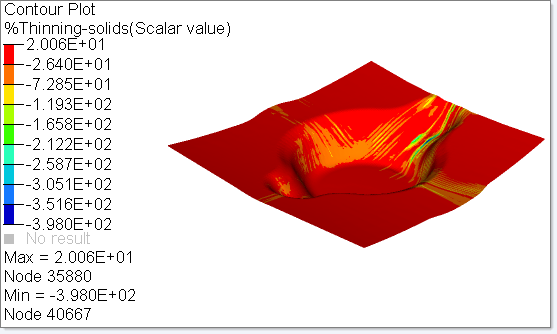
| 5. | For Result type, select %Thinning-solids(s), and then click Apply. |
The Nodal distance between the top ply and bottom ply for the last time step is displayed as a contour, as you see in the following figure. This contour does not change with time.
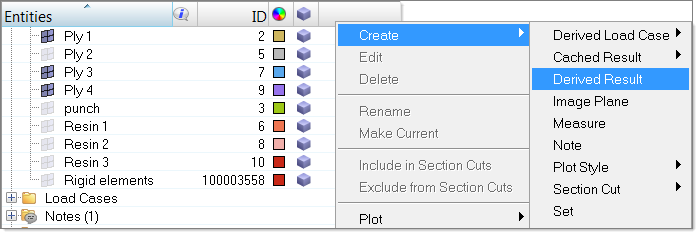
| 6. | From the Model browser, right-click, and select Create > Derived Result: |
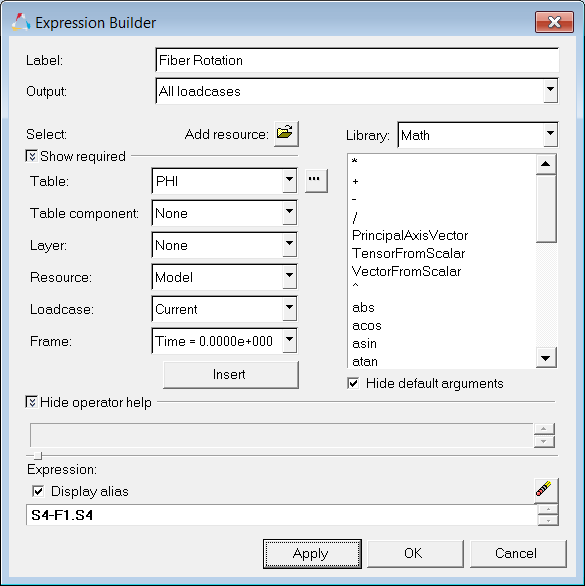
| 7. | In the Expression Builder that appears, populate the fields as follows: |
| • | For Label, enter Fiber Rotation. |
| • | Click Insert. At the bottom of the dialog, in the field under Expression, S4 appears. |
| • | For Show required, select the downward arrows. |
| • | For Frame, select Time: 0.0000e+000. |
| • | In the field under Expression, enter a hyphen (-) after S4, and then click Insert. F1.S4 appears next to the hyphen and the command reads: S4-F1.S4 |
| • | Check that the fields in the Expression Builder look like the ones in the following figure, and then click Apply. |
On the Contour panel, a new Result type, Fiber Rotation(s), is added to the drop down menu.
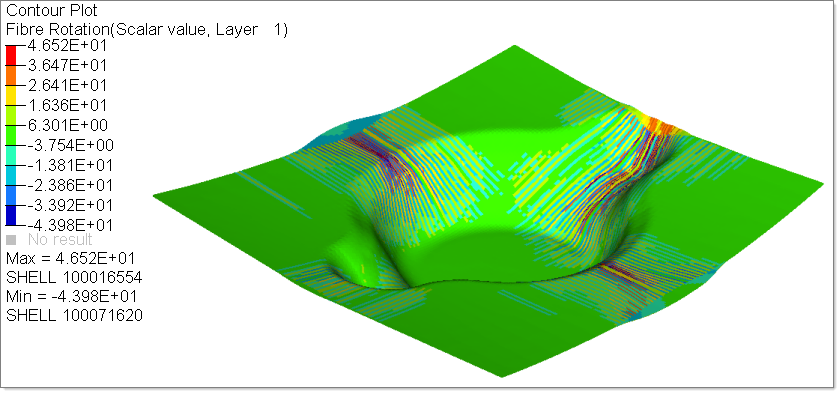
| 9. | For Result type, select Fiber Rotation(s). |
| 10. | In the Model browser, turn off Ply 2, Ply 3 and Ply 4. |
| 11. | In the Contour panel, for Layers, select Layer 1, and then click Apply. |
The Fiber Rotation for Layer1 is displayed you see in the following figure:
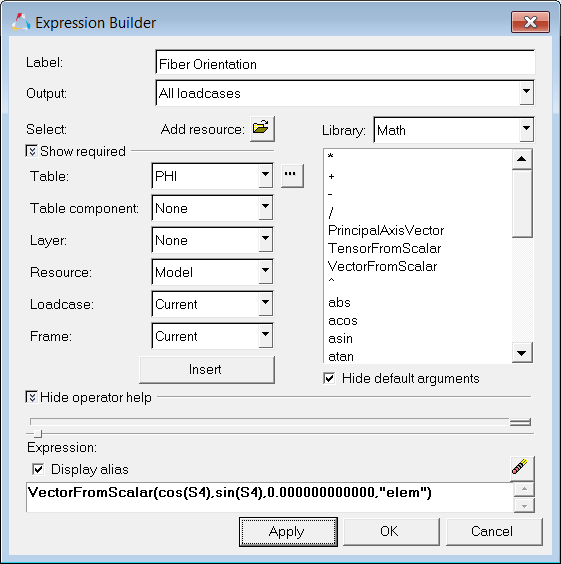
| 12. | In the Model browser, right-click, and then select Create > Derive Result. |
| 13. | In the Expression Builder, select the options as you see in the following figure. In the editor under Expression, copy and paste the following string: VectorFromScalar(cos(S4),sin(S4),0.000000000000,"elem") |
A new result type called Fiber Orientation (s) appears under the contour and vector panel.
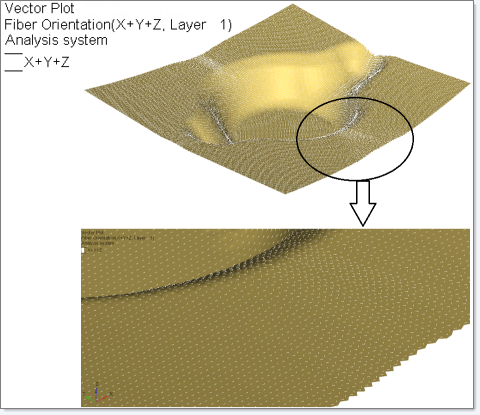
| 15. | For Result type, select Fiber Orientation (s). |
| 16. | For Layers, select Layer 1. |
| 17. | On the Display tab, do the following: |
| • | For Size scaling, select By Magnitude and enter 1.0. |
| • | For Color by, select Direction. |
The Fiber Orientation is displayed for each element with a vector as you see in the following figure:
|