In general, the material flow is controlled by the blankholder and a resultant restraining force is created by friction between the tools and the blank. However, during a forming process, it is common that a blankholder does not make contact with an entire blank. Therefore, material flow is usually not fully controlled by the blankholder.
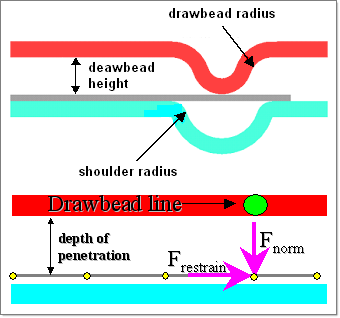
When a high restraining force is required, a higher blankholder force must be applied, which could cause wear in the tools. A local control mechanism is therefore necessary to restrain the material flow sufficiently at relatively low blankholder pressure. This is achieved by applying drawbeads.
The drawbead creates a restraining force by cyclically bending and unbending the sheet as it traverses the drawbead, causing strain hardening and a change in the strain distribution with consequential thinning of the blank.
HyperForm lets you define a restraining force for the drawbead in two ways: qualitative (pressure level) or quantitative (restrain force). You can also define a lockbead, which will apply a 100 percent restraining condition.
HyperForm provides drawbead function both for One-Step and Incremental analysis. The interface of the Drawbead panel is switched automatically based on the currently-selected analysis type.
In this tutorial, you will learn to define drawbeads for One-Step analysis. You will also use the Circle Grid panel to show relative magnitudes and associated direction of major and minor strains.
This tutorial uses the Drawbeads panel, Run Analysis macro and the Circle Grid panel.
This exercise uses the model file drawbead_1step.hf.
| 1. | From the File menu, click Open. |
| 2. | Navigate to the file drawbead_1step.hf. |
Note: The model files for this tutorial are located in the file mfs-1.zip in the subdirectory \hf\1Step\. See Accessing Model Files.
|
| 1. | Click Setup > Drawbeads. |
| 2. | Select the restrain radio button. |
| 3. | Click drawbead and type Drawbead1. |
| 4. | Pick a drawbead condition: force level = medium. |
(High is 80 percent, Medium is 50 percent and Low is 20 percent of necking condition).
| 5. | Click the color button, and then select green from the color palette. |
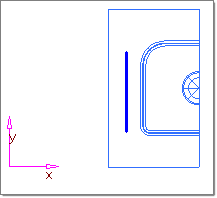
| 6. | With the halo surrounding node list, pick two nodes on the blank as indicated in the image below to define the drawbeads. |
| 7. | Click create. A message shows "The drawbead set has been created". A line is created representing drawbeads. |
|
Modeling the exact drawbead geometry requires a large number of elements, which increases CPU time dramatically. A practical approach is to use an equivalent drawbead model by representing the drawbead analytically and providing a constant drawbead restraining force and closure force.
Use the calculate subpanel to determine the closure and restraining force based on drawbead dimensions. The restraining force is the value of the force (per unit length) applied by the bead in the plane of the blank surface. The closure force is the force (per unit length) required in the perpendicular direction to keep the drawbead closed.
| 1. | Select the green calculate button. |
| 2. | Click material: and select the current blank material (CRDQ steel). |
| 3. | Verify that the drawbead height, shoulder radius, and drawbead radius are set to 6.25. |
| 4. | Click calculate. Notice that the output restraint force, closure force and necking result are calculated accordingly. |
| 5. | Click update to go back to the Drawbeads panel. If the geometry is such that a necking condition exists, the message, Material Locking Condition is displayed on the status bar. |
|
| 1. | From the File menu, click Save As. |
| 2. | Enter the file name as drawbead_1step_complete.hf, and then click Save. |
| 3. | Click Setup > Run Analysis. |
| 4. | Make sure project: is set to drawbead_1step_complete.hf. |
| 6. | Click load results when your job has finished. |
|
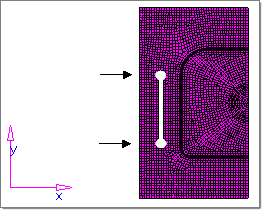
| 1. | Click Tools > % Thinning to view the thinning contour plot. |
| 2. | Click contour to review the result. |
| 3. | Click return to close the panel. |
|
| 1. | Click Tools > Formability. |
| 2. | Select the Part component. |
| 3. | Click Create FLD, and then click FLD contour. |
|
|
This exercise uses the result from Exercise 1, drawbead_1step_complete.hf.
In circle grid analysis, a sheet of metal is prepared by etching a circle grid onto the surface. Plastic deformation in the steel during the forming operation causes the circles to deform into ellipses. The plastic strain at each circle is then calculated from the major and minor diameters of the ellipses.
In HyperForm, the Circle Grid panel allows you to show relative magnitudes and associated direction of major and minor strains with respect to deformed mode by displaying circles drawn on the blank surface. A result file needs to be loaded before performing circle grid analysis.
| 1. | Click Tools > Circle Grid. |
| 2. | Pick the elements you want to display. |
| 3. | Select Initial Circle to show the initial status of the blank. |
| 4. | Select Deformed Circle to show the final deformed status of the blank. |
| 5. | Set the switch to cir & dir, cir only, or dir only to show the circles and/or major and minor deformed direction. |
| 6. | Click draw. The circle grid is displayed. If you change the display method, click draw again to refresh the screen. |
| 7. | To clear the circles and/or directions, click clear. |
| 8. | Click return to close the panel. |
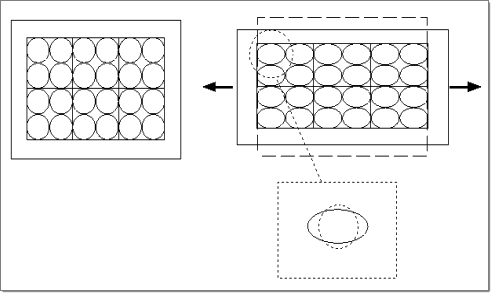
Circle grids on initial and deformed blanks
|
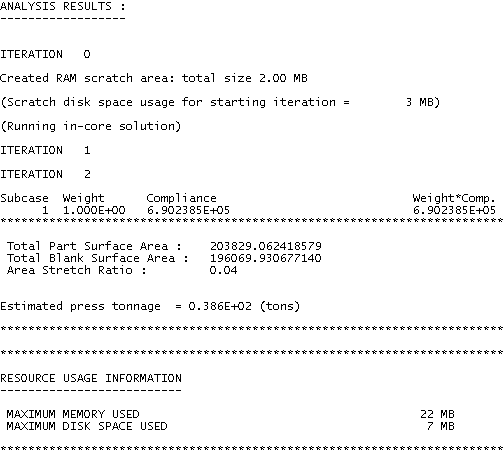
The HyperForm solver also outputs the estimated press tonnage required to form the part. The press tonnage is written out in the output file.
| 1. | Click Setup > Run Analysis. |
| 3. | Select 1- to view the text in graphics area. Scroll down toward the bottom. The estimated press tonnage output can be seen as shown in the figure below. |
| 4. | When finished, click Close to close the report, and click return to close the panel. |
|
|
Return to RADIOSS One Step Tutorials


