Plot SPC/SPCD
Use the Plot SPC/SPCD tool to display the SPC/SPCD assigned to the nodes in their relevant analysis (output) system. The tool shows the coefficients of the selected degrees of freedom (DOF) and the ID of the system associated to the node(s) where the constraint is applied.
-
Click Apply.
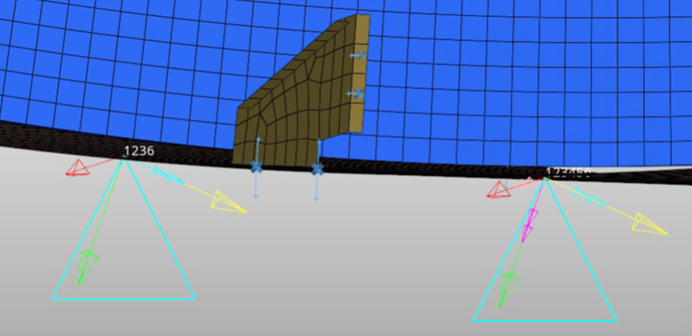
Figure 1. . The SPC on the left has four DOF blocked, so you can see them (X-Traslation, Y-Translation, Z-Translation and Z-Rotation). The SPC on the right has all DOF blocked, so you can see six arrows, corresponding to the six DOF.