Defining a Forming Limit Curve

  1. From the FLD panel, click Add under the FLD Studies list.
    A new study is appended to the list and the study type is displayed next to the study name.
    Note: The studies are sequentially named Study 1, Study 2, and so on, based on the number of studies already in the list.
    Tip: Use the Rename (right-click context menu) option to rename the new study if desired.
  2. Select the FLC tab.
    The FLC tab is used to define the forming limit curve that will be used to plot the forming limit diagram.
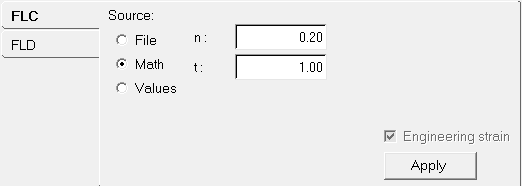

    Figure 1. FLC Tab
  3. Under Source, select the method that will be used to define the curve.
    Option Description
    File Load curve data from an existing file. Click the file browser button and select a file.
    Important: When using the File option, the file you are using must contain the header, XYDATA, material name and the footer, ENDDATA (all upper case). The data between the header and footer must be in two columns, separated by spaces.
    Math Mathematically define a curve in true strain metric by entering values for the strain hardening component (n) and material thickness (t).

    The following formula is used to calculate the fld0:

    (0.23+0.146*t)*n/0.21

    Where t is in mm.

    Values Define a curve from a set of x-y data points corresponding to the minor and major strains. Click Add and enter the XY values.
  4. Optional: Activate the Engineering check box to assign an Engineering Strain metric to the FLC data provided by File and Values.
    A True Strain metric will be used if the Engineering box is unchecked.
  5. Click Apply.
    The settings are applied and the curve is defined. A HyperGraph window is added that displays the defined curve alongside the model.
You can now create the forming limit diagram plot using the FLD tab.
Note: Several curves can be created in the same session and turned on and off for display.