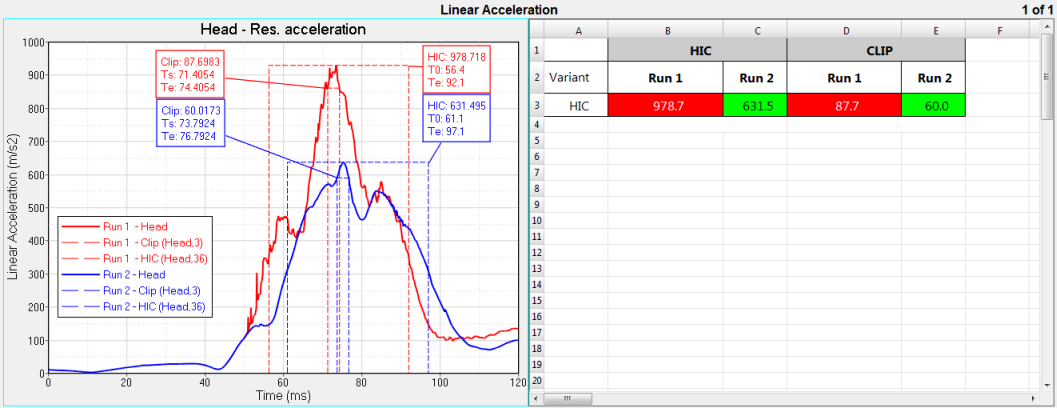
HWD-0070: Summary Tables Using Report Overlay
- Use the Append as Row and Append as Column overlay modes in TableView
- Use the Parameters Browser
- Use the Flexible Reports Panel to overlay a report
Tools
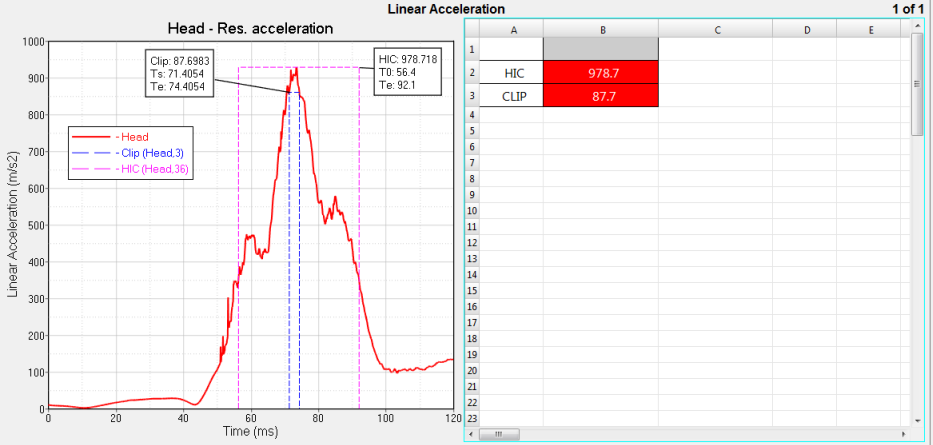
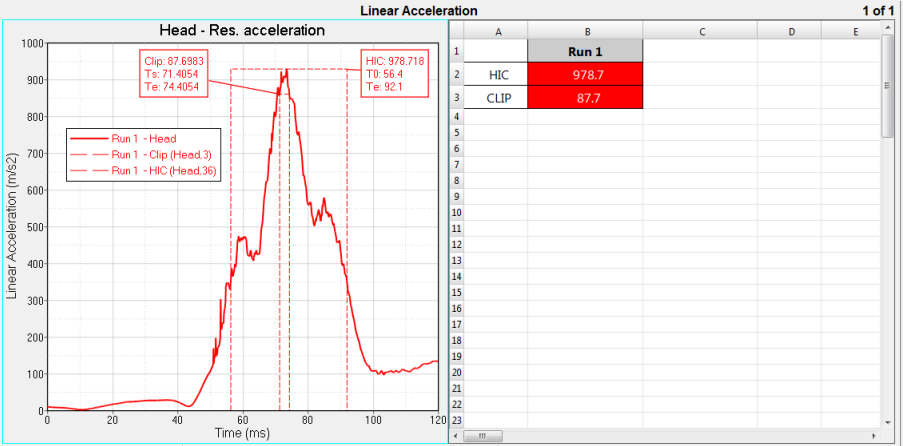
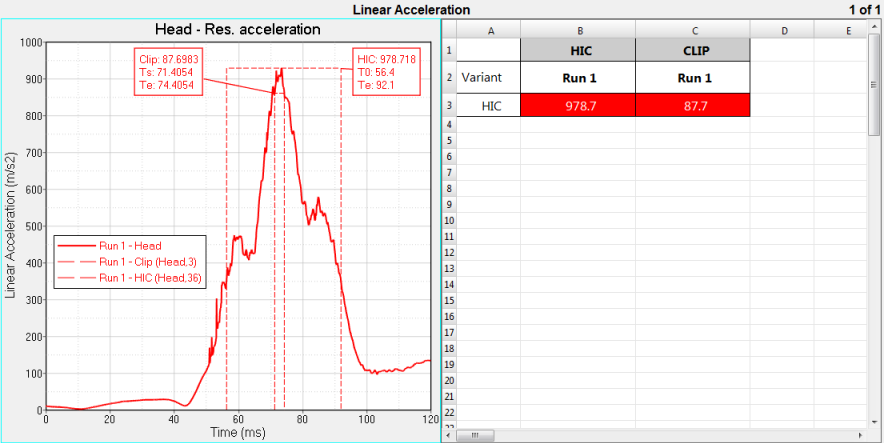
TableView creates an Excel-like spreadsheet inside of HyperWorks Desktop. You can use Templex expressions inside of a cell to synchronize with HyperGraph and create summary tables that update accordingly using report templates. Value-dependent formatting allows for the easy detection of critical key performance indicators (KPI's). Basic spreadsheet functionality to format and edit table cells is also available. You can copy data from TableView and paste it into an Excel spreadsheet, and vice versa.
To access TableView, select TableView from the Select Application menu.
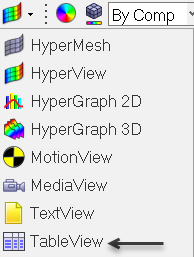
Figure 1.
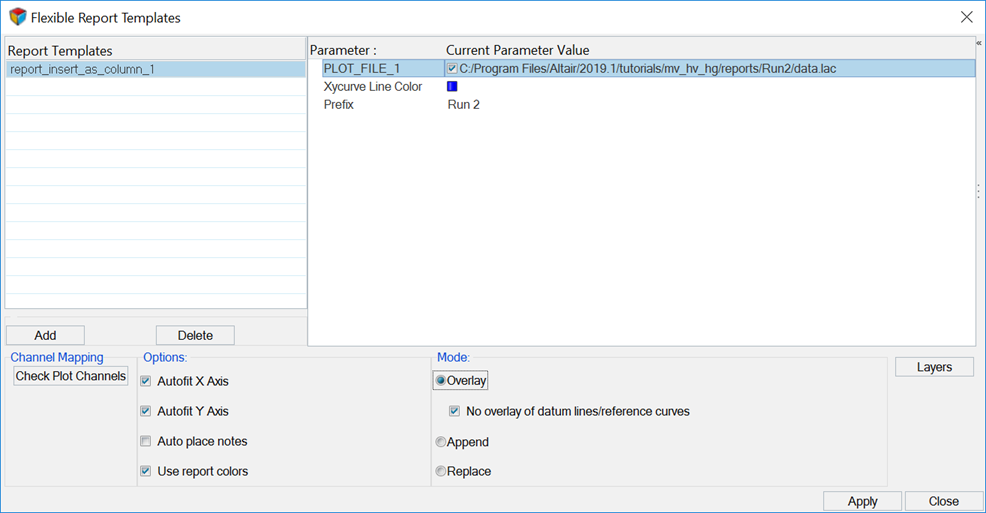
To access the Flexible Reports Templates panel, click the Open Report Panel icon,
![]() ,from the Reports toolbar.
,from the Reports toolbar.
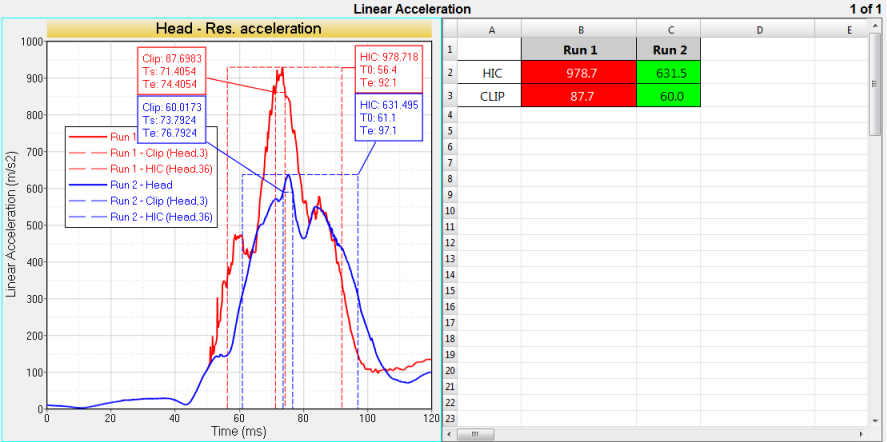
The Flexible Report Templates panel allows you to add or overlay predefined page sets to the current session. This replaces the Reports panel from earlier HyperWorks Desktop versions. The panel allows you to easily compare test and simulation data. In addition to the standard Report panel features, Channel Mapping is available, which allows you to reconcile mismatched channels (Type, Request and Component data). You can save the reconnected channels to a configuration file and use this file later. From the panel, you can directly edit parameter attributes for parameters created with the Parameters Browser.
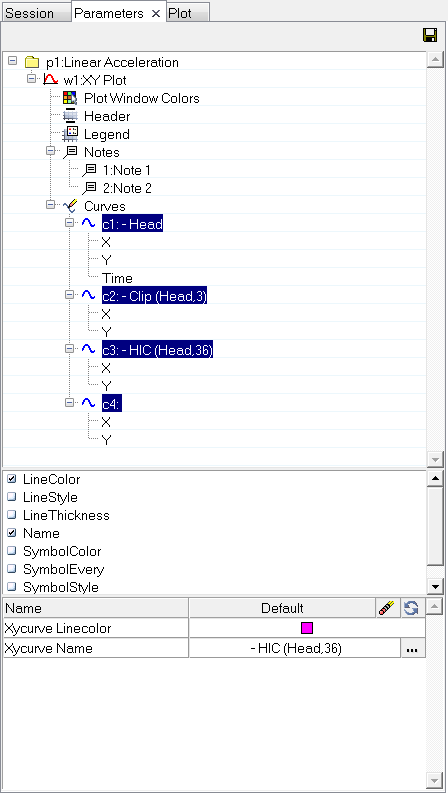
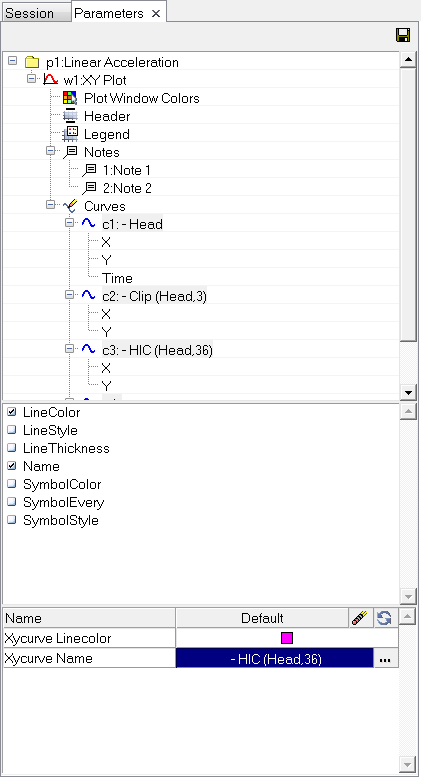
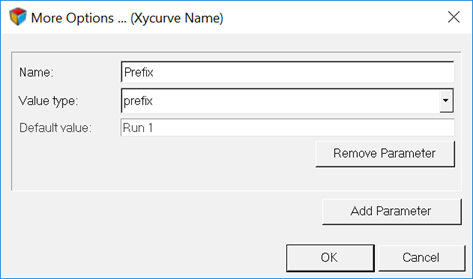
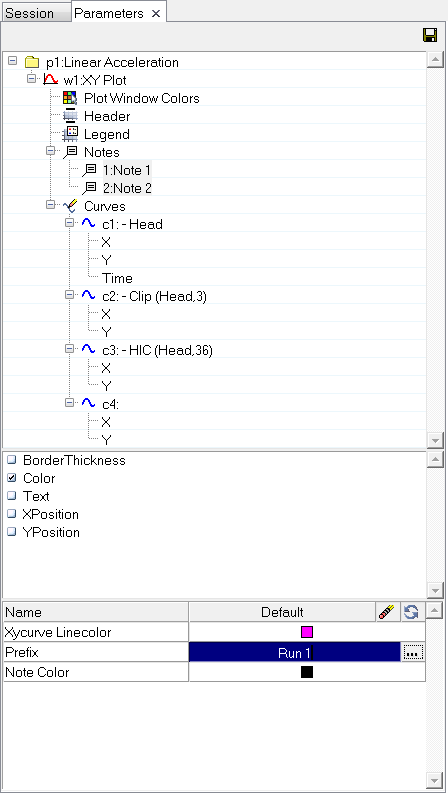
The Parameters Browser, which is used with report templates, lets you parametrize almost everything in a session file or report template and automate a variety of analysis processes in HyperWorks Desktop. The reality of automation is that it is not always desirable to re-apply automation scripts exactly as they were originally defined. To remedy this, the Parameters Browser includes a graphical user interface for defining parameters that can be changed when an automation script is executed. After the parameters are defined, you can save the automation script and run it from the Report Templates panel.
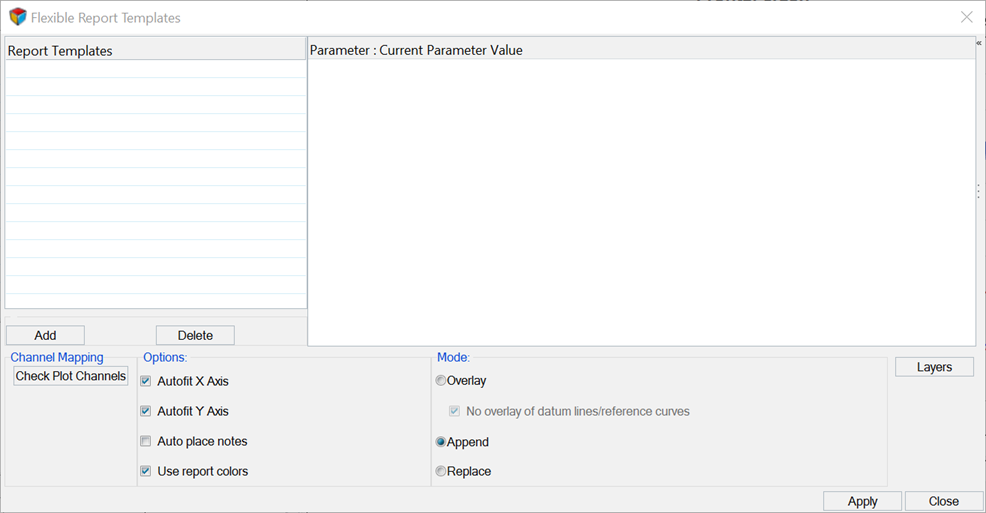
Figure 2.
To display the browser, click .
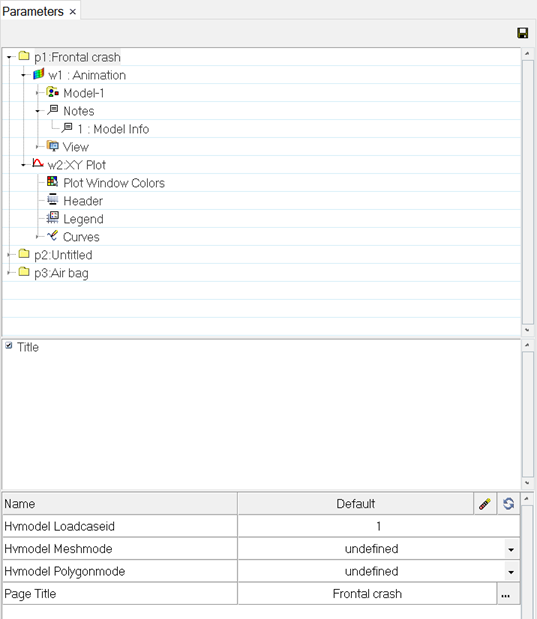
Figure 3.
Open Session File
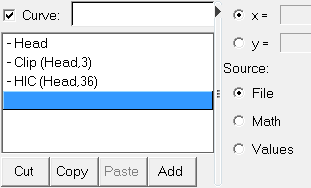
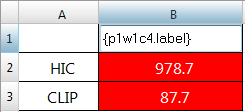
Empty Curve for Header Label
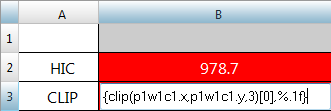
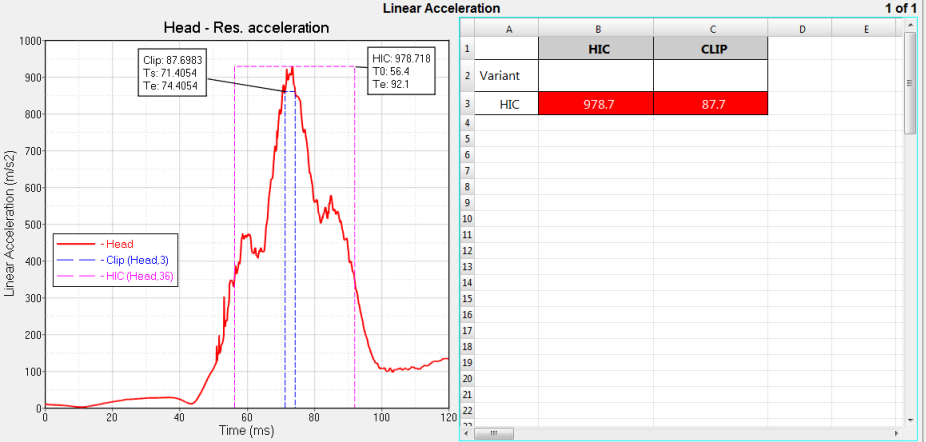
Add and Delete Rules in TableView
Create Report Parameters
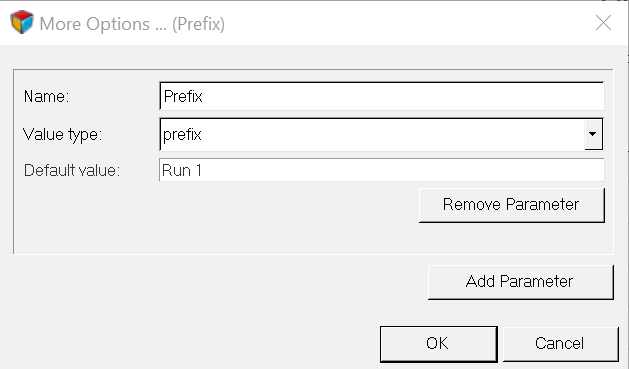
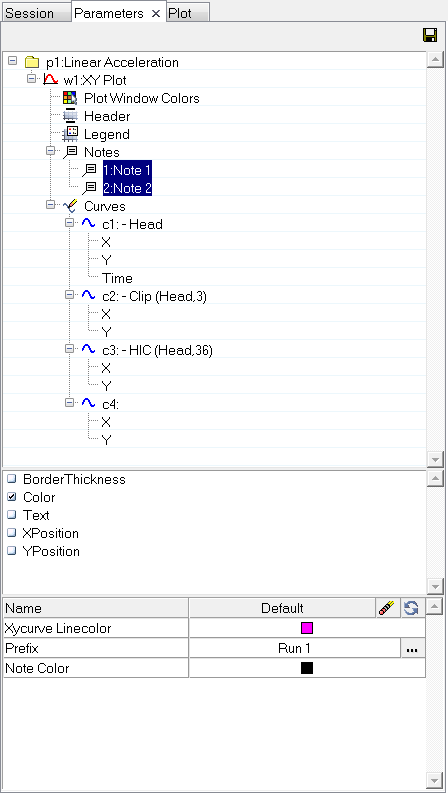
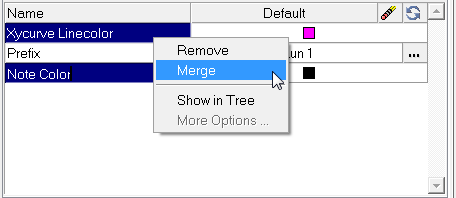
The following step describes how to parametrize the report template so that the prefix that describes the solver run is displayed in the curve name as a prefix, as well as in the table header row. In addition, a parameter is created which ensures that all notes and curves from the report have the same color.
