HWD-0030: Report Generation and Automating Data
- Create and use report templates to automate the processing of animation, plot, and text data
- Overlay and append plot, animation, and video data with report templates
- Display and hide layers of data in plot windows
- Display and hide models in animation windows
Tools
- From the Report toolbar, click the Open Reports Panel button,
 .
.
The Flexible Report Templates dialog allows you to add (append, replace, or overlay) predefined page sets in report templates to the current HyperWorks Desktop session. A report template automates the processing of different sets of similar data. Report templates contain a list of report definition statements that specify how to process results for particular test or analysis data files.
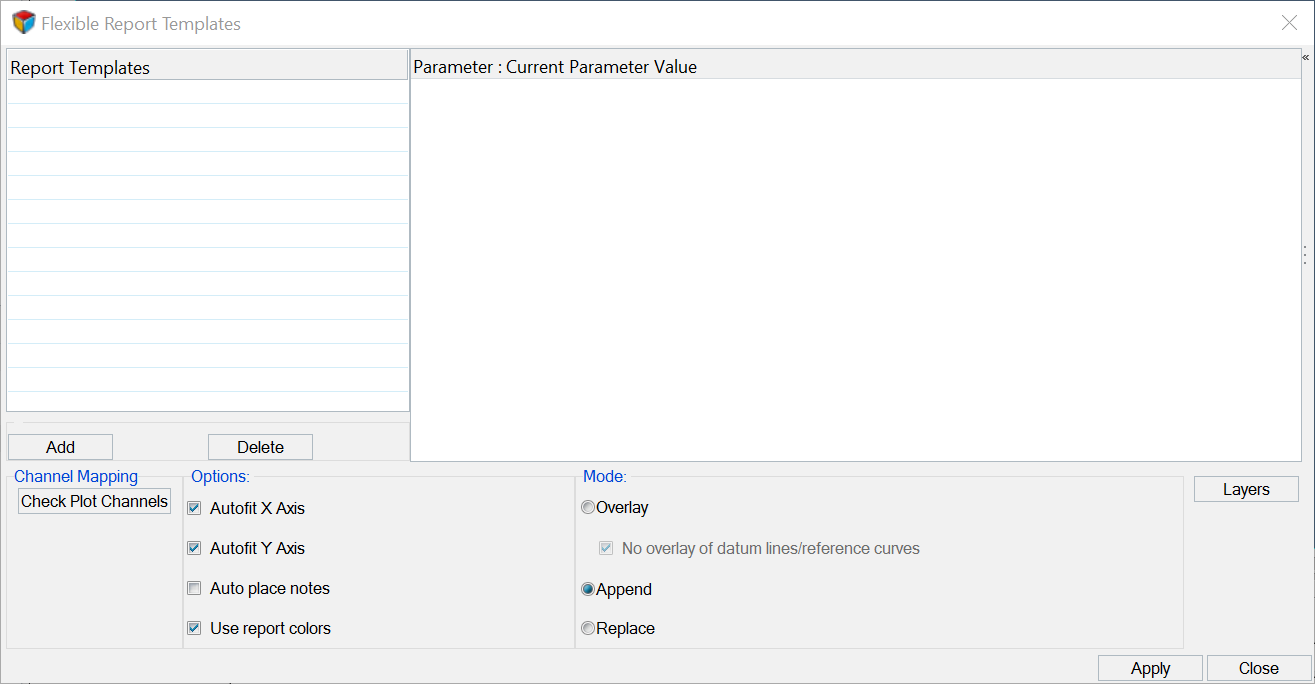
Figure 1.
The exercise in this tutorial, Creating and Using a Report Template, uses the session file airbag.mvw, and also an LS-DYNA input file and d3plot files from run two of the airbag analysis.
Open Session File airbag.mvw and Save as a Report Template File
-
From the Report toolbar, select Save As Report Template,
 , to open the Save
Report As dialog.
Notice that Save as type: is set to Report Template (*.tpl).
, to open the Save
Report As dialog.
Notice that Save as type: is set to Report Template (*.tpl). -
Save the report template file as airbag_new.
When the report file is saved, the extension *.tpl is appended to the file’s name if the extension is not already present in the filename.
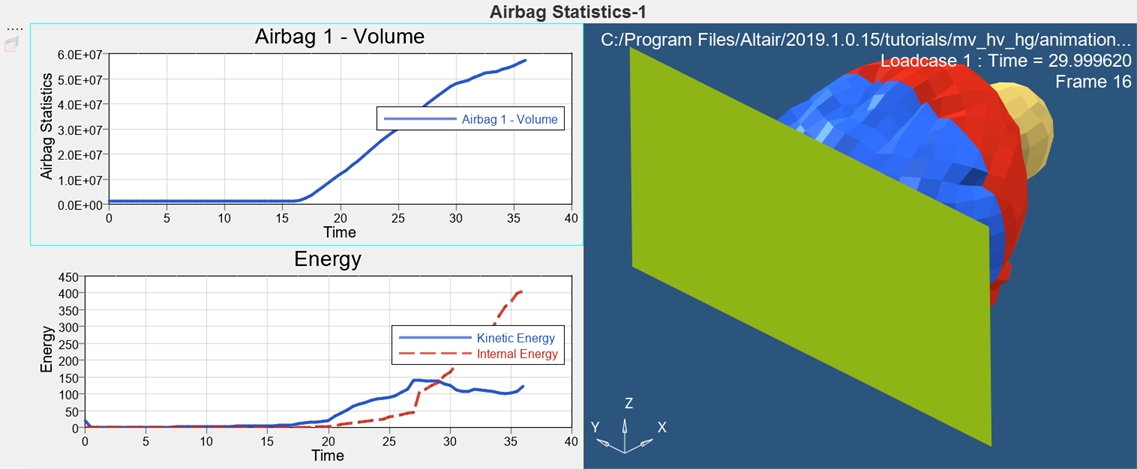
Figure 2.
Automate Post-processing of Results by Using the Report Template
The template’s four file parameters are listed in the middle of the panel. They represent the four data files used in the session (for run 1 of the airbag analysis) from which the report template was created. The parameter’s default values are the names of the files used in the session.
-
From the Report toolbar, click the Open Reports Panel button, .
-
If the template is not loaded follow the steps below:
- Click Add to add a Report Template to the dialog.
- Select airbag_new.tpl from the list of files and click Open.
The template’s four file parameters are listed in the middle of the panel. They represent the four data files used in the session (for run 1 of the airbag analysis) from which the report template was created. The parameter’s default values are the names of the files used in the session.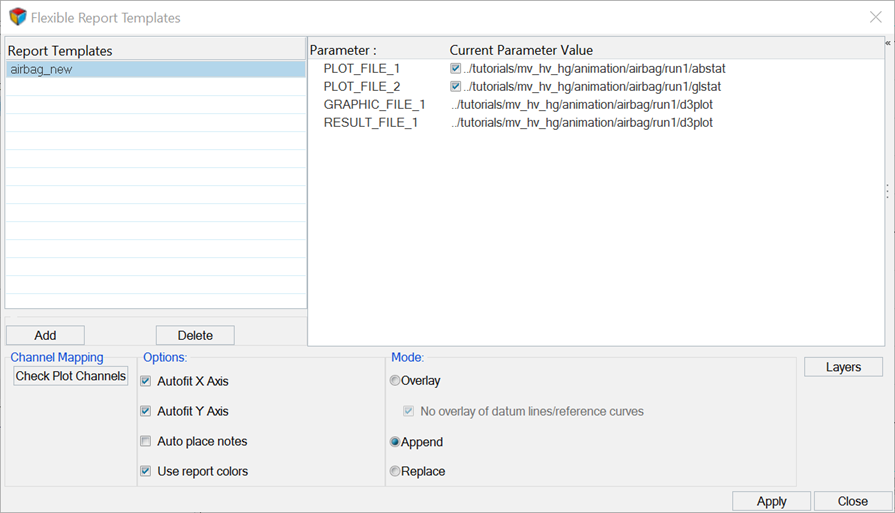
Figure 3. -
To autofill the remaining files in the Reports panel, simply right-click on
file path next to GRAPHIC_FILE_1 and select Autofill
directory.
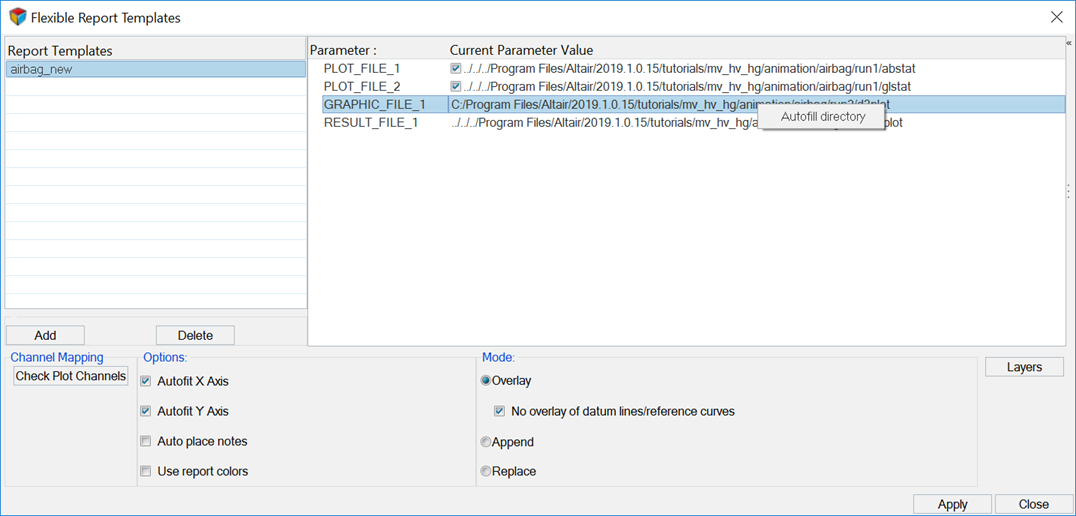
Figure 4.By selecting Autofill directory, the other files needed for this report template are updated to use the files in the selected directory.
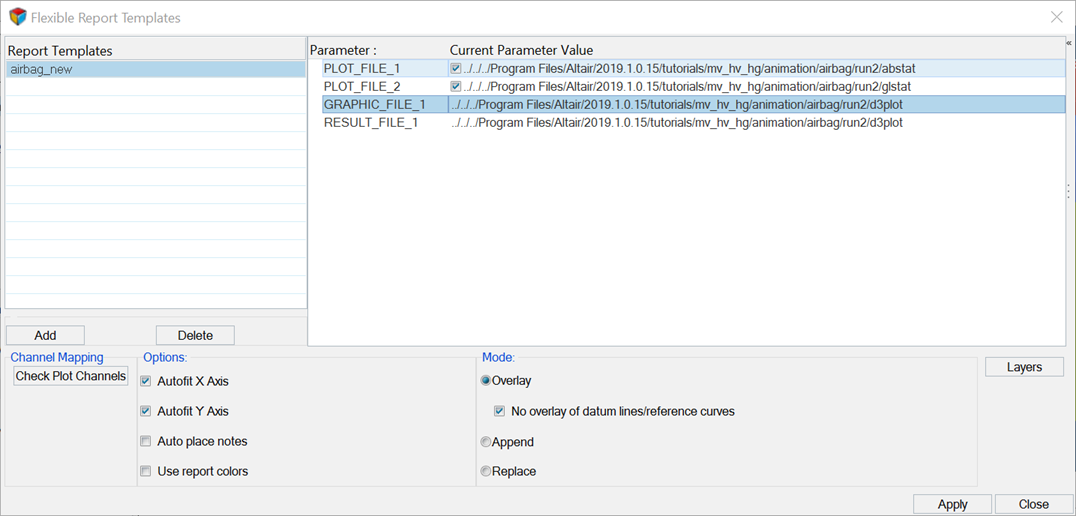
Figure 5. -
Click Apply to add data from run two of the airbag
analysis to the session.
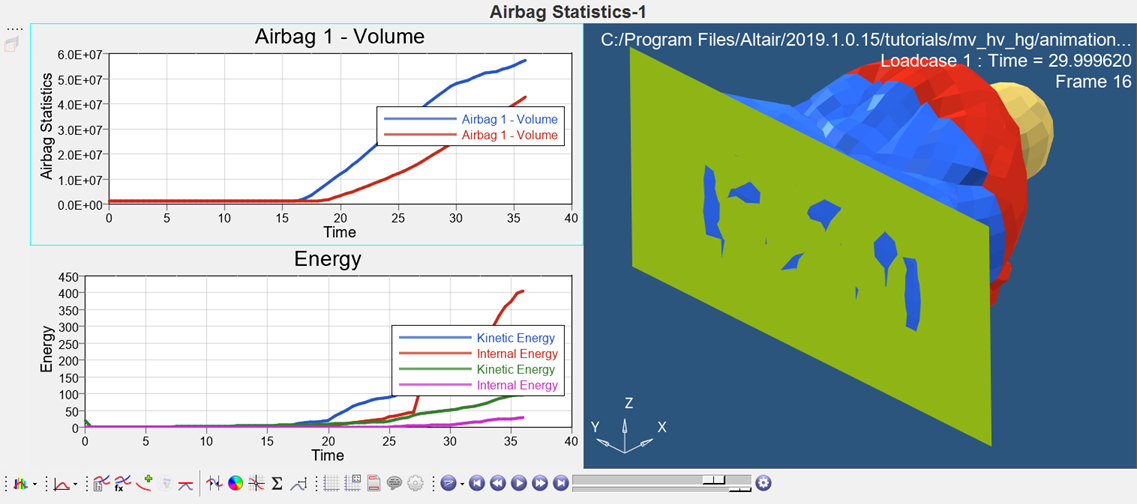
Figure 6.
Turn On and Off Curve Layers in Plot Windows
-
From the Reports dialog, click Layers to open the Layers
dialog.
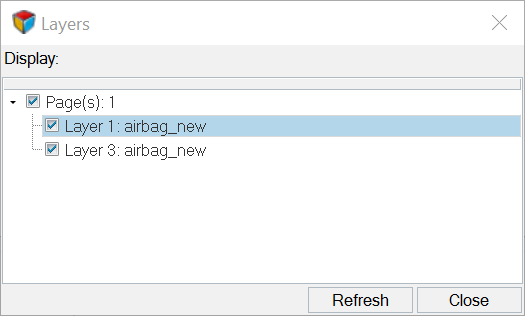
Figure 7.