SetAttr
Changes the curve and axes' properties.
Syntax
<Curve Editor Object> SetAttr “curve” <Curve Id> <-name value pair args>
<Curve Editor Object> SetAttr “axis” <axis identifier> <-name value pair args>
<Curve Editor Object> SetAttr “plot” 1 <-name value pair args>
Description
SetAttr can be used to set/change various curve properties as well as axes properties. Properties can be passed as a name-value pair. In a single call, multiple properties can be changed.
Arguments (for curves)
- identifier
- The entity (curve/axis) to edit properties for.
- curve id
- The index of the curve to edit properties for.
- args
- Various arguments to be passed as a -name.
- visibility
- Change the visibility of the curve.
- showlabelprefix
- Show/hide the label prefix.
- labelprefix
- Label prefix of the curve.
- showlabel
- Show/hide the name.
- label
- Name of the curve.
- showlabelsuffix
- Show/hide the label suffix.
- labelsuffix
- Label suffix of the curve.
- linestyle
- Line style index. Same index as shown in the property editor (0-indexed).
- linecolor
- Color index. Same index as shown in the property editor (0-indexed).
- linethickness
- Line thickness index. Same index as shown in the property editor (0-indexed)
- shadearea
- Turn on/off shading.
- symbolstyle
- Symbol style for coordinates. Same index as shown in the property editor (0-indexed).
- symbolcolor
- The index of the color to be used for the symbol style (0 indexed).
- symbolfrequency
- Symbol frequency of the curve.
- symbolsize
- Sets the symbol thickness of the curve.
- barstyle
- Change bar style (only applies to the bar type plot).
- barcolor
- Changes the bar color (only applies to the bar type plot).
Arguments (for axes)
- args
- Various arguments to be passed as a -name value pairs.
- visibility
- Show/hide axis from the plot.
- text
- Change the text displayed for the axis.
- min
- Change the minimum value of the axis.
- max
- Change maximum value of the axis.
- ticsperaxis
- Change the number of tics for the axis by giving the total number of tics.
- gridspertic
- Change the number of grids per tic.
- reverse
- Reverse the axis.
Arguments (for plot)
- barorientation
- Vertical or horizontal for displaying the bar vertically or horizontally.
Returns
None.
Example
$editor SetAttr curve 1 -label c1 -symbolstyle 1
$editor SetAttr axis x -reverse true -min 1.0 -max 4.0 -text time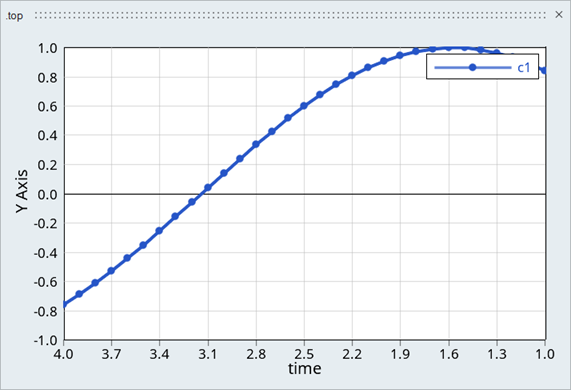
Figure 1.
set editor [::hw::CurveEditor .t]
$editor SetType bar
$editor Add -category [list Jan Feb Mar Apr] -y [list 10 15 30 52 26] -y 0:25:5
$editor SetAttr plot 1 -barorientation vertical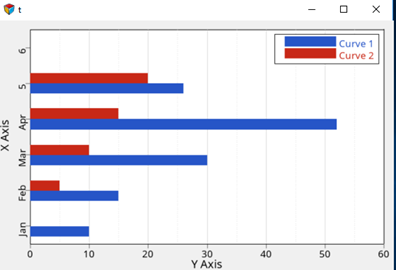
Figure 2.