Results Description
- H3D results file loaded upon evaluation
- Text results output with utilization ratios for the top N failed elements
In addition to the fatigue evaluation results, static assessment results are also given.
Text Results Description
Text output contains the details of the critical evaluation locations and any element results that have been queried.
- Evaluation location detail
- Stress values
- Utilization values
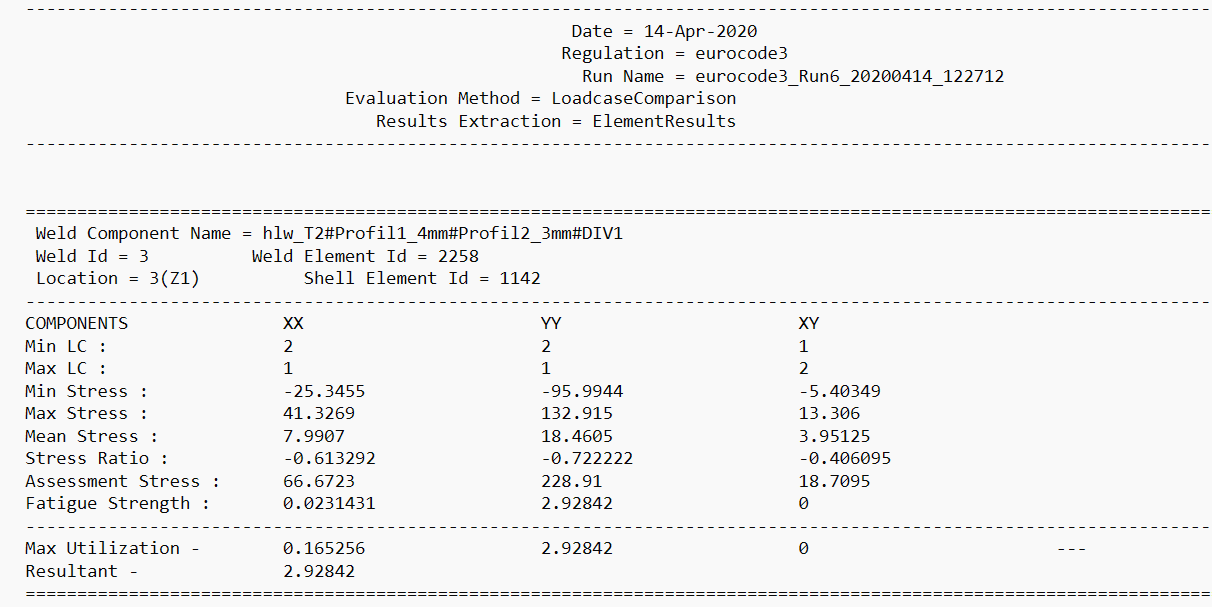
Figure 1.
Each data block corresponds to a weld element at one evaluation location.
- Min Stress
-
Minimum stress values from across the fatigue loadcases selected for evaluation.
- Max Stress
-
Maximum stress values from across the fatigue loadcases selected for evaluation.Note: Both the above stress values are obtained from the transformed elemental stress tensor.
- Stress Ratio
- Ratio of Min stress to Max stress.
- Mean Stress
(Max stress + Min stress) / 2- Stress Amplitude
(Max stress - Min stress) / 2- Min LC
- The load case id from which the Min Stress component has been extracted.
- Max LC
- The load case with the Max Stress value for this particular location.
- Assessment Stress
- The stress value used as the numerator in the calculation of utilization. This value is calculated based on the specification and can be either the max value (DVS) of the stress or the stress amplitude (FKM).
- Fatigue Strength
- The fatigue limit stress used as the denominator in the calculation of utilization. This value is calculated based on the specification, using the fatigue curves, stress ratio, and the mean stress value.
- Shell Utilization
- Fatigue utilization ratio values for the critical location. Contains the utilization ratios for each direction and also the resultant utilization value.
- 1D Utilization
- Fatigue utilization ratio values for the critical weld element. Contains the utilization ratios for each directional component and also the resultant utilization value.
Shell and 1D Utilization
The values for 1D utilization are the maximum utilization ratios across all locations pertaining to the weld element. These are obtained after comparing the utilization results from the shell elements associated with the weld element. In some cases, the values for the shell utilization and 1D utilization will not match. Shell utilization corresponds to the utilization from the location with the highest resultant utilization value.
Calculation of Assessment Stress
Assessment stress is calculated based on the specification selected. In some cases it’s the maximum stress magnitude, and in other cases it’s the stress amplitude value.
Utilization Components
- Longitudinal – Result in the parallel direction to the weld line (x-axis of the weld system).
- Transverse - Result in the perpendicular direction to the weld line.
- For base material - Y axis of the weld system
- For web material - Z axis of the weld system
- Shear - Along the plane with the longitudinal and transverse directions.
Evaluation Results Description
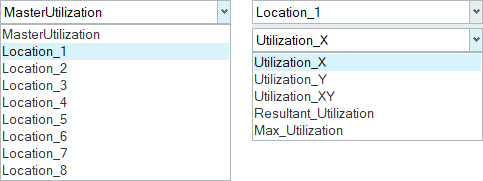
Figure 2.
- Master Utilization
- Contains the highest utilization of each evaluation location.
- Location_N
- Contains the utilization results available for location N, where N is 1
to 6 (max number of locations possible). The results components
available in this type are:
- Utilization_X – utilization ratio for the X (parallel) stress component.
- Utilization_Y – utilization ratio for the Y (perpendicular) stress component
- Utilization_XY – utilization ratio for the XY (shear) stress component.
Note: The X, Y and XY direction references are based on the weld line coordinate system.
Master Utilization
- By default, HL-WC posts the master utilization results that show the data of the highest utilization value for all locations.
- The evaluation results show the plot of the utilization ratio of the fatigue evaluation at each location of the weld.
- The highest utilization ratio value out of all the locations is mapped to
the corresponding 1D element.
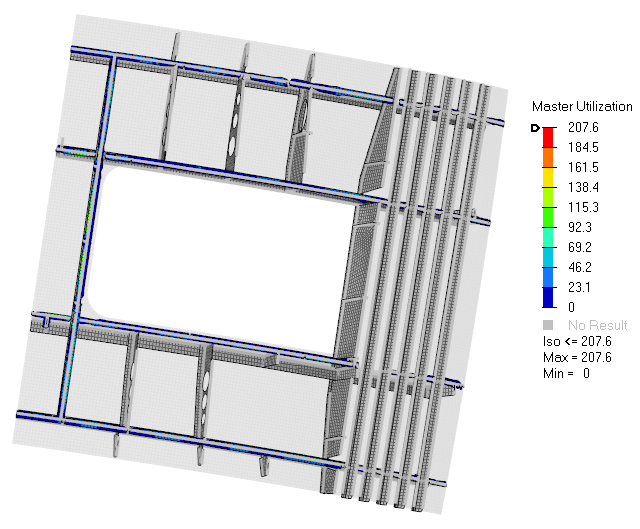
Figure 3.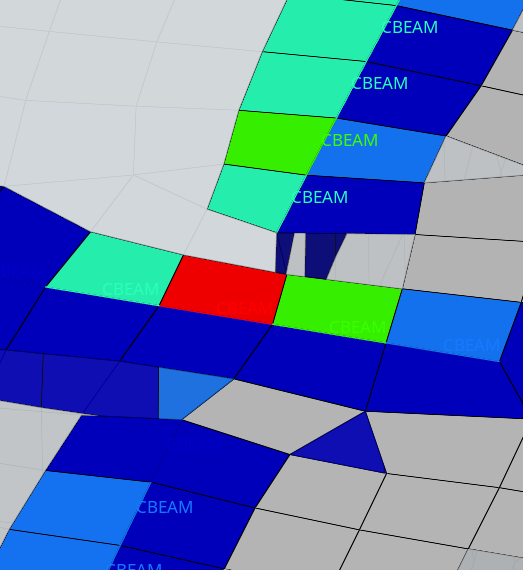
Figure 4.