HG3D-2020: Query Data for Surface Plots
In this tutorial, you will learn how to query data from the surface plot and create and use datum planes.
The Coordinate Info panel can be accessed one of the following ways:
- On the toolbar, click the Coordinate Info icon,

- From the menu bar, select
The Coordinate Info panel allows you to retrieve individual point data on any curve in the active window. When a point on a curve is selected, the point data is displayed on the panel. Using the coordinate info panel you can retrieve data from three curve types: 3D line, surface, and waterfall. The panel options change depending on the curve in the active window.
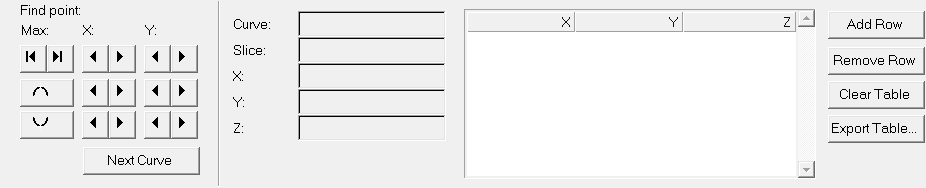
Figure 1.
The Datum Planes panel can be accessed by:
- Clicking the Datum Planes icon,
 , from the toolbar
 - From the menu bar, select
The Datum Planes panel allows you to insert reference datum planes to plots.
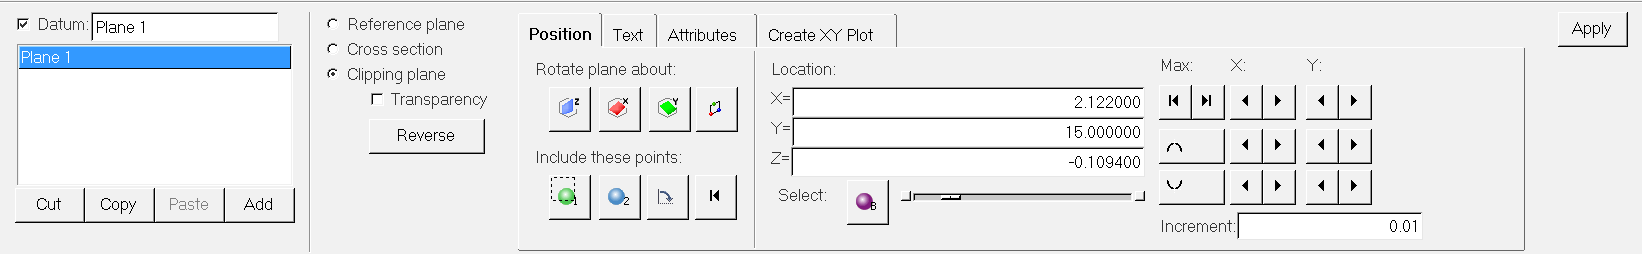
Figure 2.
Open Session File
-
Select the file Curve_Attributes_Surface.mvw and click
Open.
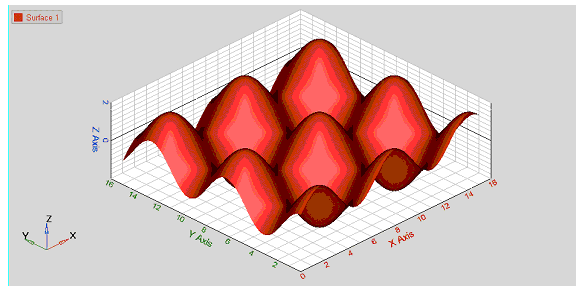 Figure 3.
Query XYZ Values Using the Coordinate Info Panel
-
Click the Coordinate Info icon,
 .
Note: A bubble with the XYZ values is seen in the graphics area.
.
Note: A bubble with the XYZ values is seen in the graphics area. -
Repeat the operation to build a table.
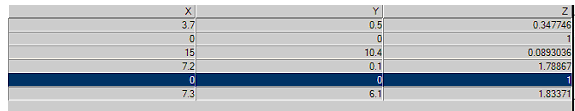 Figure 4.
Use Datum Planes as Reference Planes
-
Click the Datum Planes panel icon,
 .
.
-
Move the slider bar in the panel area to move the reference plane along the Z
plane.
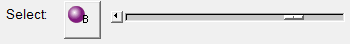 Figure 5.
 -
Click the icons
 and
and  to change the orientation of the plane along the X and
Y axis, respectively.
to change the orientation of the plane along the X and
Y axis, respectively.
-
Click
 to create a plane with three points of your
choice.
to create a plane with three points of your
choice.
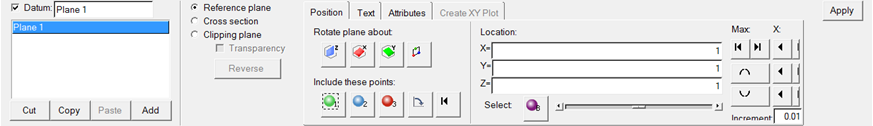 Figure 6.
 -
Click
 and
and  to move the reference plane to the maximum and minimum
point in the surface plots, respectively
to move the reference plane to the maximum and minimum
point in the surface plots, respectively
-
Click the arrows,
 , to move to the next/previous point or to the local
maximum/ local minimum along the X and Y axis.
, to move to the next/previous point or to the local
maximum/ local minimum along the X and Y axis.
Use Datum Planes as Clipping Planes and Plot Cross Section
-
Move the slider bar and note the change in the clipping area from the
screen.
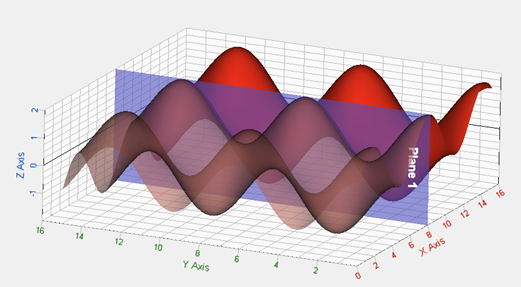 Figure 7.
 -
Click Plot Data.
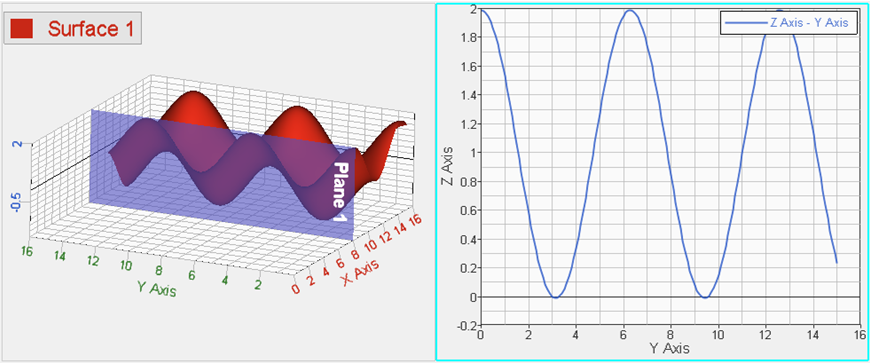 Figure 8.
 -
Click the Fit icon,
 , to fit the plot to the window.