HG3D-2000: Define Surface Plots
In this tutorial, you will learn how to create surface plots.
The Define Curves panel can be accessed one of the following ways:
- On the toolbar, click the Define Curves panel icon,

- From the menu bar, select
The Define Curves panel enables you to create new Surface plots. New data can be mathematically defined using the program's curve calculator, or entered as values.
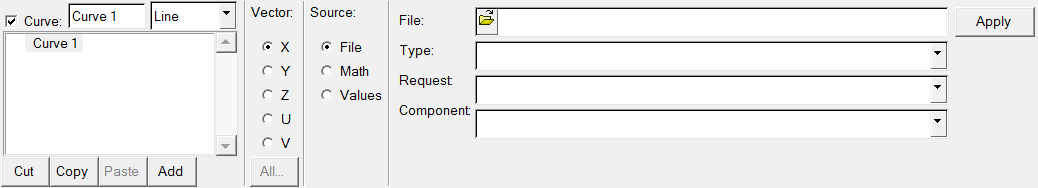
Figure 1.
Create a Surface Plot from a Math Expression
-
Click the Define Curves icon,
 , to access the panel.
-
Select Surface from the drop-down menu.
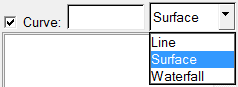 Figure 2.
 -
Set Z to sin(x) + cos(y).
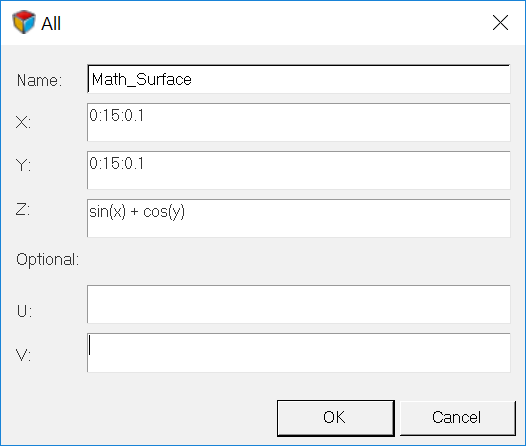 Figure 3.
 -
Click Apply to create the surface plot.
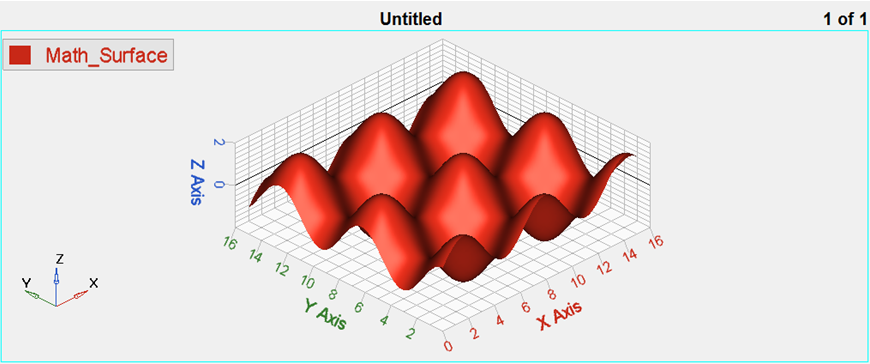 Figure 4.