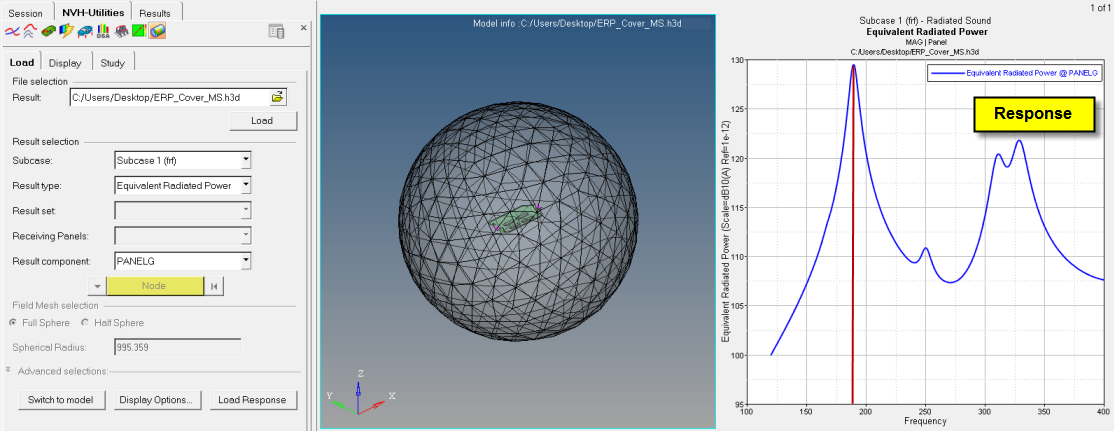
Plot a Response for Radiated Sound From the Radiated Sound Load tab, load the result file to view and load the model. Make a selection from the Subcase drop-down menu. Select a Result type from the drop-down menu: Equivalent Radiated Power, Sound Power, or Sound Pressure. If you select Equivalent Radiated Power: From the Result component drop-down menu, select a panel. Click Load Response to plot the response: Linear/dB (Magnitude) Linear/Octaves (Frequency) The utility automatically switches to the Display tab. If you select Sound Power for the result type: For Result set, select Source Side or Receiver Side. Click Load Response to plot the response. The utility automatically switches to the Display tab. If you select Sound Pressure for the result type: For Result set, select Sound Pressure or Power from Pressure. For Receiving Panels, select a set that corresponds to particular source nodes. This can be used for panel participation. For Result component, select the microphone location: Select a node from list Select the microphone location from model Click Load Response to plot the response. The utility automatically switches to the Display tab. Figure 1.