Perform contribution analysis for the vehicle response between sensitivity and
forces, with the respective files loaded in the Loadcase Processing tab, the vehicle
response calculated or loaded, and the loadcases selected in the Vehicle Response tab,
Powertrain input, or Road Profile input.
Order Contribution Tab
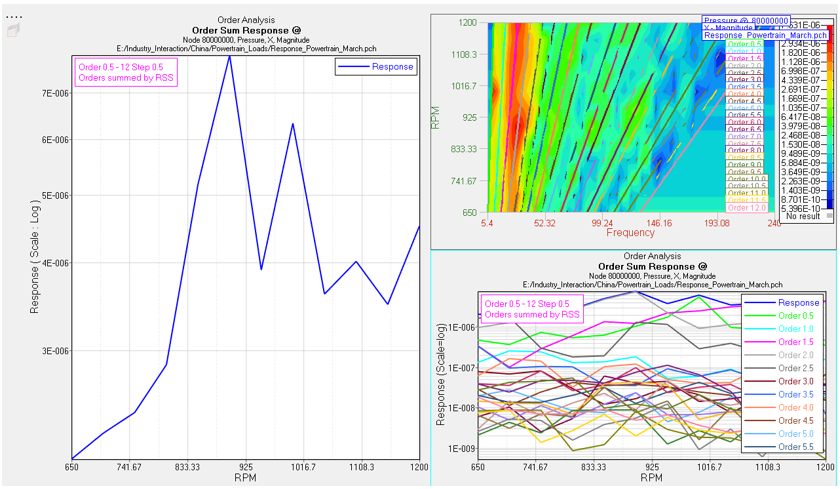
Overall response is plotted after you have selected the powertrain input loadcase in
the Vehicle Response tab with the corresponding sensitivity and forces result file
in the Loadcase Processing tab. The Order Contribution tab allows you to plot the
waterfall diagram and perform order cut analysis.
Figure 1. Order contribution for overall response in powertrain input
loadcase
Order Cuts
After viewing the surface plot, use the Start, End, and Step fields to
specify the orders you want to see by cutting the surface plot.
Combine Order By - Choose between RSS and Arithmetic Sum to determine
how to combine the order curves to construct the overall response.
Display Options
The Display Options dialog allows you to customize the
overall response plot, including scale, weighting, and the
plot layout.
Load Response
Once your selections are complete, click Load Response to
create the orders and order sum response overlay plot.
Bar
Creates a bar plot of the response at a specific frequency
or RPM.
Enter a specific RPM in the Specific RPM field, or use the
slider bar to select an RPM value. When you use the slider
bar to select an RPM, a red line is displayed on the
response plot and is dragged simultaneously as you drag the
slider bar.
No. of highest order
After selecting the specific RPM, organize the
display by selecting the number of highest
orders.
Rank by
Define the method that is used to rank orders
with one of the following options:
Magnitude - Orders are ranked by the magnitude
of the order. Available for bar plot.
Display Options
The Display Options dialog allows you to further
customize the plot.
Display
Click Display to create and display the
plot.
2D Line
Creates a 2-D line plot of the response for a range of
frequency or RPM.
RPM range
Select the RPM range that the order curves
should be plotted within.
No. of highest order
After defining the RPM range, organize the
display by selecting the number of highest orders.
Rank by
Define the method that is used to rank orders
with one of the following options:
RSS Magnitude - Orders are ranked by the root
sum of squares of the magnitude of the order at
selected frequencies. Available for 2-D line and
3-D surface plots.
3D Surface
Creates a 3-D Surface plot of the response within an RPM range.
RPM range indicates the available range, based on your results
file.
Using the From and To fields, you can customize your own RPM range.
All other options are similar to those for the 2-D Line plot.
Load Path Contribution
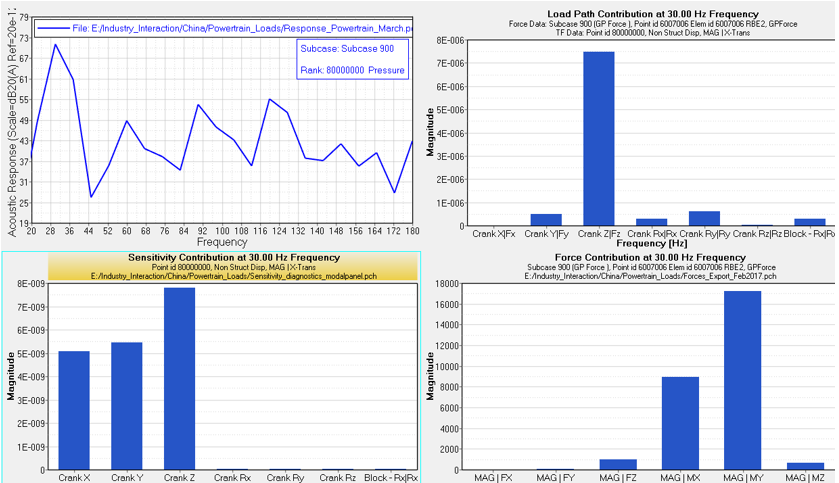
After you have selected the powertrain inputs loadcase in the Vehicle Response tab,
with the corresponding sensitivity and forces results file in the Loadcase
Processing Tab, the Load Path Contribution tab allows you to perform contribution
analysis with respect to the sensitivity and forces for an RPM sub-case based on the
vehicle response.
Figure 2. Load Path Contribution for RPM based response in powertrain input
loadcase
Bar
Creates a bar plot of the response at a specific frequency.
Enter a specific frequency in the Specific Frequency field, or use the
slider bar to select a frequency value. When you use the slider bar to
select a frequency, a red line is displayed on the response plot and is
dragged simultaneously as you drag the slider bar.
Display Options
The Display Options dialog allows you to further customize
the plot.
Display
Click Display to create and display the plot.
2D Line
Creates a 2-D line plot of the response for a range of frequency.
Frequency range
Select the frequency range that the response curves should
be plotted within.
Wheel Contribution Tab
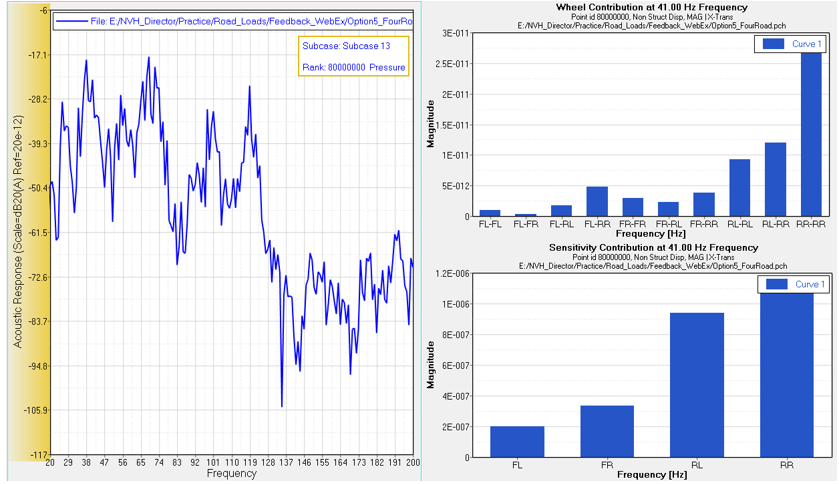
After you have selected the road profile inputs loadcase in the Vehicle Response tab
with the corresponding sensitivity and forces results file in the Sensitivity and
Forces Tab, the Wheel Contribution sub-tab allows you to perform a contribution
analysis with respect to the wheel contribution and sensitivity for a vehicle
response, corresponding to the random loads subcase.
Figure 3. Wheel contribution for random loads subcase, based on response in road
profile inputs loadcase
Bar
Creates a bar plot of the response at a specific frequency.
Enter a specific frequency in the Specific Frequency field, or use the
slider bar to select a frequency value. When you use the slider bar to
select a frequency, a red line is displayed on the response plot and is
dragged simultaneously as you drag the slider bar.
Display Options
The Display Options dialog allows you to further customize
the plot.
Display
Click Display to create and display
the plot.
2D Line
Creates a 2-D line plot of the response for a range of frequency.
Frequency range
Select the frequency range that the response curves should
be plotted within.