Energy Distribution - Study
After plotting the energy contribution curves, perform a Partial sum, Modify energy, or Energy overlay response study.
- Frequency range
- Indicates the available range, based on the frequencies that your energy distribution analysis has performed.
- Type
- The response study type.
- % to exclude
- Optional field that allows you to exclude a percentage of the energy distribution from the total system energy.
- You can also filter energy contributors to a smaller set by clicking the
Filter Contributors dialog icon,
 .
. - Select contributors to
- Select the energy distribution that you want to exclude or include in
the response study.
- Click
 to select the entire list of
contributors.
to select the entire list of
contributors. - Click
 to deselect your current
selections.
to deselect your current
selections. - Click
 energy distribution for the
unselected energy distribution in the list.
energy distribution for the
unselected energy distribution in the list.
- Click
- Show difference curve as
- Shows a difference curve between the original energy distribution analysis response and the Partial sum or the Modified energy energy distribution analysis response curves.
- Display Options
- Use the Display Options dialog to further customize the plot.
- Display
- Displays the response study plot once your selections are complete.
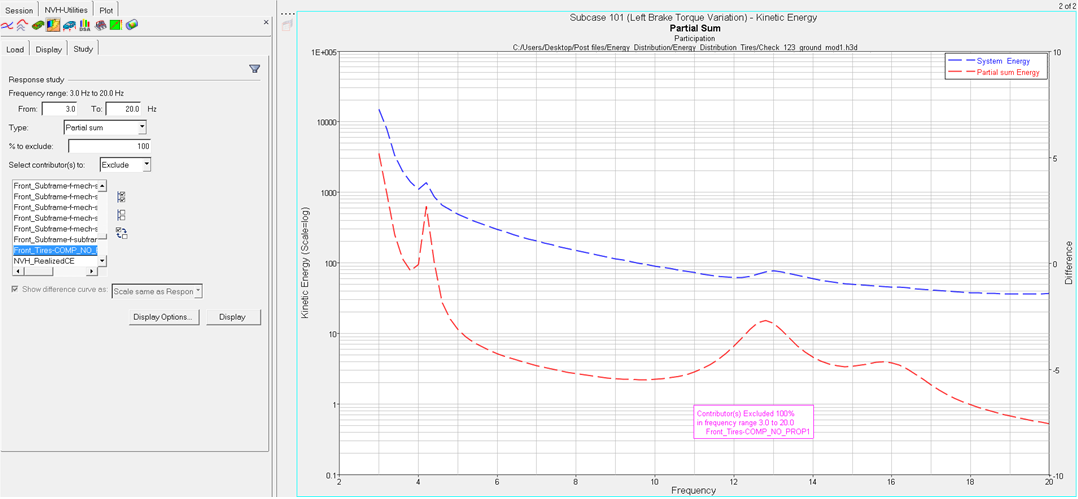
Figure 1. Partial sum plot