Headers and Footers
The Headers and Footers panel enables you to add headers and footers to your plots, specify font colors, and access the Fonts dialog.
Plot headers and footers are titles displayed at the top and bottom of a HyperGraph 2D window, respectively. They can be added to any HyperGraph 2D window. Each HyperGraph 2D window can display a header and a footer.
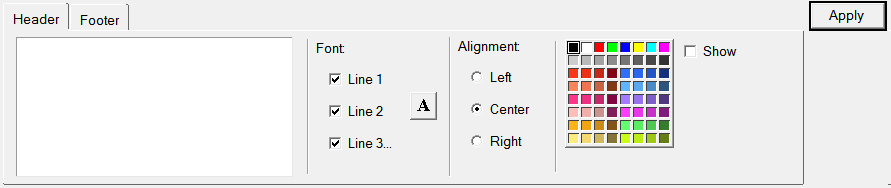
Figure 1.
Plot headers and footers are accessed by clicking on the corresponding tab. Click the Show button to display the header or footer in the window. Titles for plot headers and footers are entered in the text box. Press Enter to add new lines.
 , to
activate the Font dialog box and change the font style, type, and size. Use the
color palette to specify the font color of the selected line.
, to
activate the Font dialog box and change the font style, type, and size. Use the
color palette to specify the font color of the selected line.On the Header tab of the Headers and Footers panel, the curve name is defined by a Templex expression instead of a fixed string. The Templex expression is visible in editable fields only. In non-editable fields, the evaluated expression is displayed. In most cases, the evaluated expression should match the text that was hard-coded in previous versions. Please see Dynamic Curve Names for more important information on this topic.
See Import Templates for more information on import templates.