Compare Solver Version Results

  1. Click the Design tab then the Solver version result comparison tab.
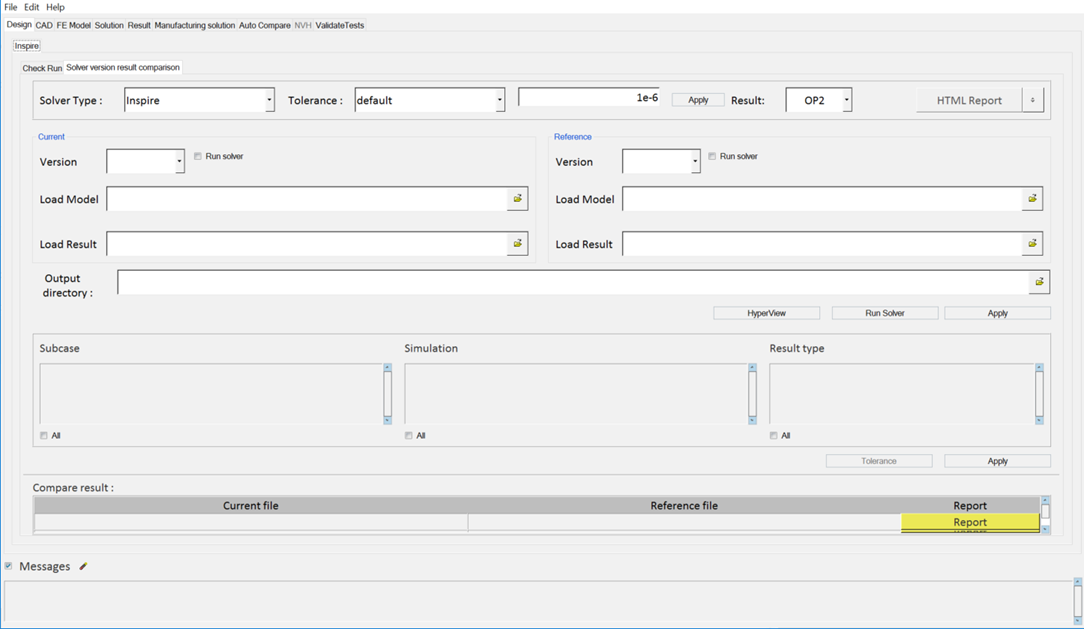

    Figure 1.
  2. From the Solver Type drop-down menu, select the result type to be compared.
    Option: Inspire
  3. Select a Tolerance method then input the value used to set the tolerance for the difference in values between the reference and current version result files during comparison.
    Option Description
    Default 1e-6 for Scalar, Tensor, and Vector, if not individually chosen.
    Scalar Enter values if different for the scalar result type.
    Vector Enter values if different for the vector result type.
    Tensor Enter values if different for the tensor result type.
    User Defined Click Tolerance and set the individual tolerance value for all data types.
  4. Click Apply to set new values.
  5. Select a result type from the Result drop-down menu.
    HVVH dynamically loads the selected result file type under Load Result on Run Solver.
  6. Choose between a PowerPoint or HTML report of the result value comparison.
    Pass
    This returns a detailed report containing one slide per data type across load cases.
    Fail
    In case of a failure, one slide per load case for each datatype is published so that it is easy to identify the load case that contains a difference in values.
  7. Select the current and reference solver version.
  8. Select the HyperView/Inspire model and results file for the current and reference version.
    Tip: Clicking Run Solver is required if the result files are not available, and the solver needs to be run to generate result files (for only one or both versions).

    The Inspire(OptiStruct) solvers invoked in batch mode and the model selected through Load Model are run, and the result file path is populated in the Load Result field.

  9. Select an output directory.
  10. Click Run Solver if the Run solver check box is activated.
  11. Click Apply.
  12. Click HyperView to launch HyperView interactive.
    Use the set of commands below for result comparison:

    ::Displaycontour – Applies the contour to the Reference result.
    ::Applytolerance – Applies the tolerance.
    ::Diffcontour – Compares the Current and Reference results for the selected datatype.

  13. Select any combination of subcases, simulations, and result types from the populated areas.
    Click All to select all items listed.
  14. Click Apply to generate data to compare the results of the chosen combination.
    The Compare result section displays the current file and the corresponding Reference file. Click Report to display the diff report detailing the differences between files.
Tip:
  • The message log file displays the current status of processes in progress. Click Status/Diff to display the respective report. The message log file is a text file and is saved to your output directory.
  • Click Html Report to generate an HTML report of your session information for any number of files run through the process.