Viewing the Results
View and post-process the results in POSTFEKO.
-
Compare the input reflection coefficient of the two methods on a Smith
chart.
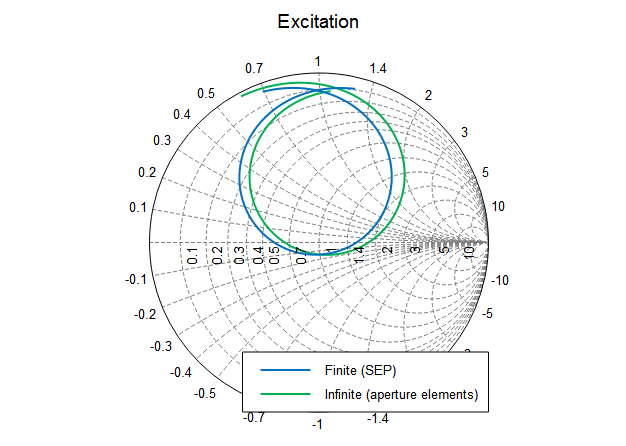
Figure 1. The input reflection coefficient of the aperture coupled patch in POSTFEKO.Note: The model using an infinite plane is a good approximation of the SEP model. -
Compare the realised gain (in dB) at boresight of both methods on a Cartesian
graph.
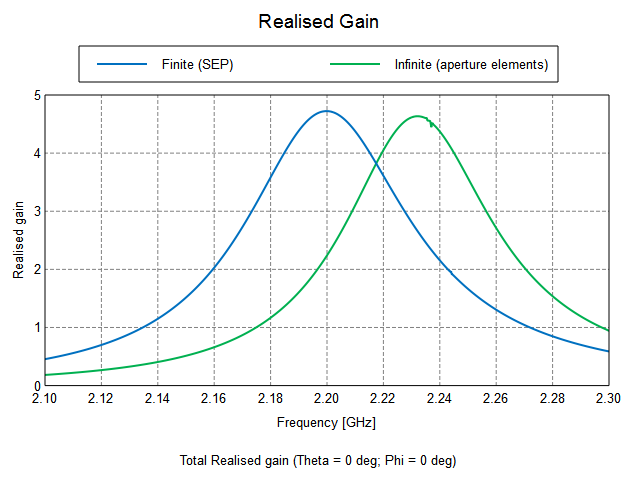
Figure 2. Far field realised gain over frequency.Note: The far fields have a similar shape and the center frequency deviates by less than 2%. Increase the size of the finite substrate to obtain an even better comparison between the two methods.