Train ML Models
Train ML models based on the dataset.
The model will be built using the collected data to predict outputs real-time value.
-
Click Next to view the Simulation Summary and Variable
Ranking.
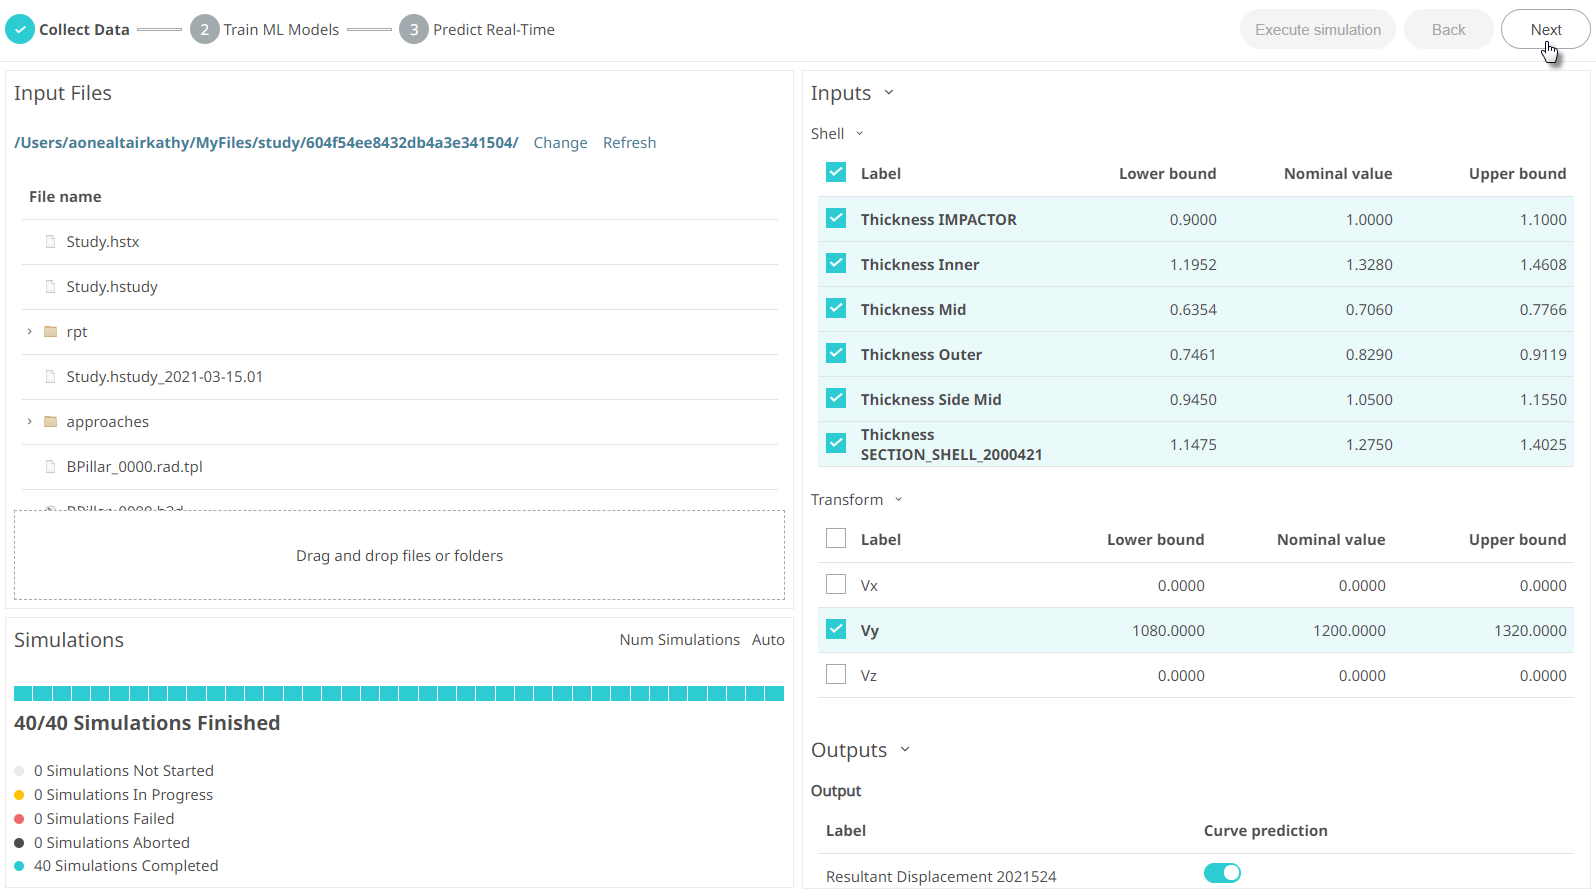
Figure 1. Train ML ModelsThe Data Summary and Variable ranking is displayed.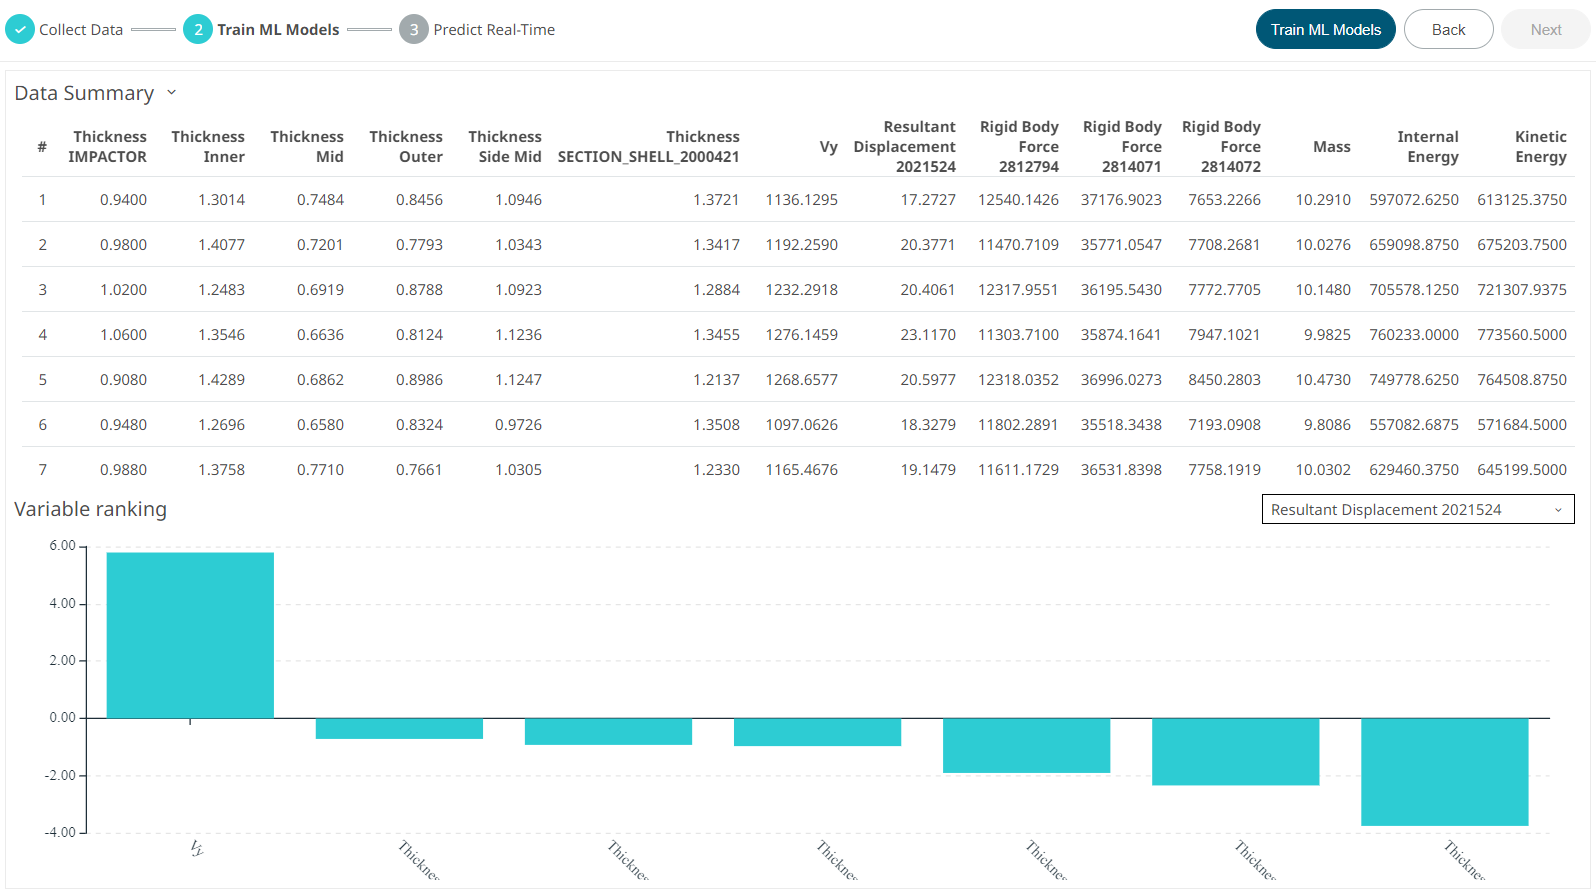
Figure 2. Simulation Summary and Variable rankingThe Data Summary displays the simulated values of the input and the corresponding output values.
Variable ranking displays the linear effects of inputs on the selected output in hierarchical order. X-axis is inputs and y-axis is the linear effect of the input on the selected output. Inputs that have positive effect on the selected output have bars on the positive y-axis. Inputs that has negative effect on the selected output have bars on the negative y-axis. Select the other outputs from the drop-down list to view the corresponding linear effects.
Note: Select the other output from the drop-down list in the Variable ranking to view its graphical representation. -
Mouse-over the graph to view its data points.
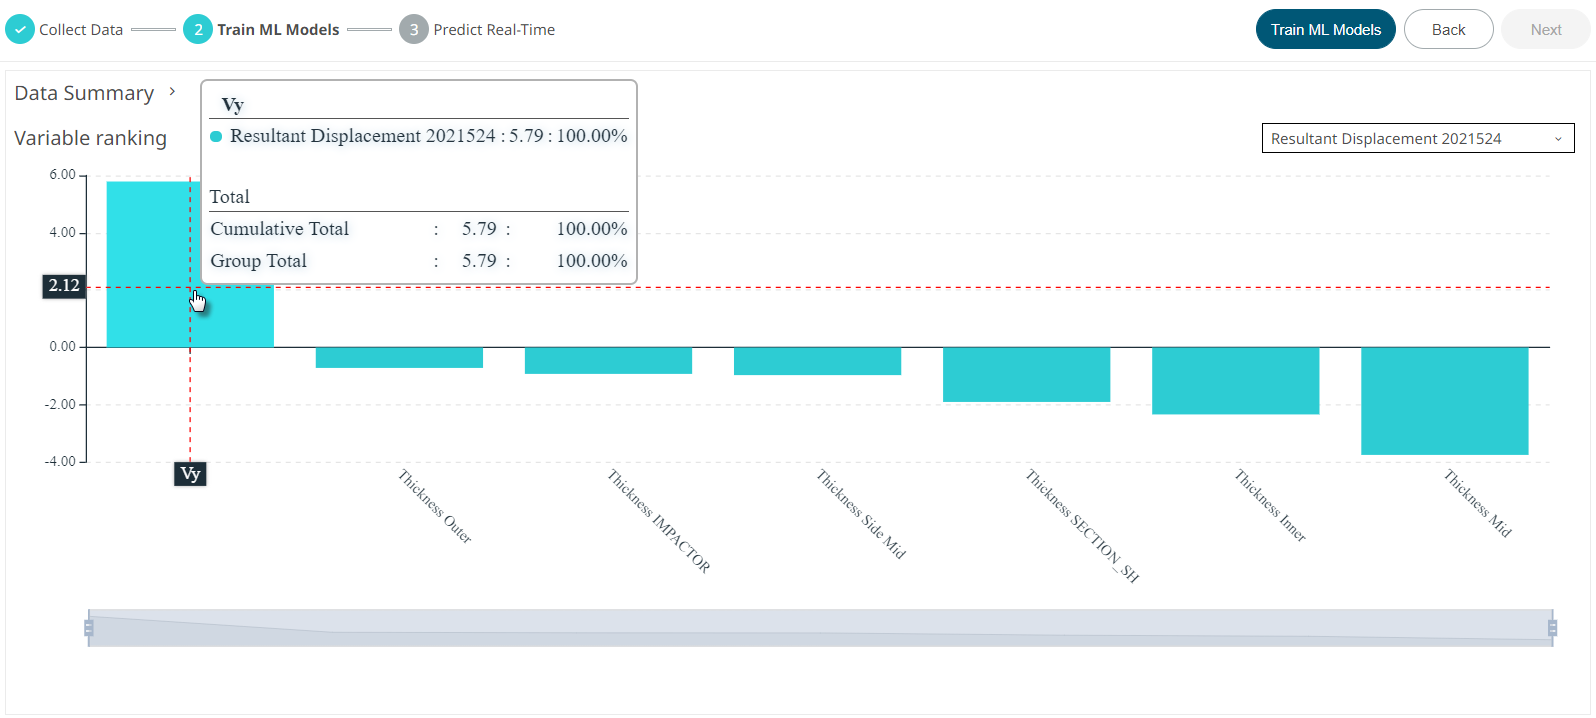
Figure 3. Variable Ranking Data PointsUse the slider at the bottom to zoom-in or zoom-out the graph.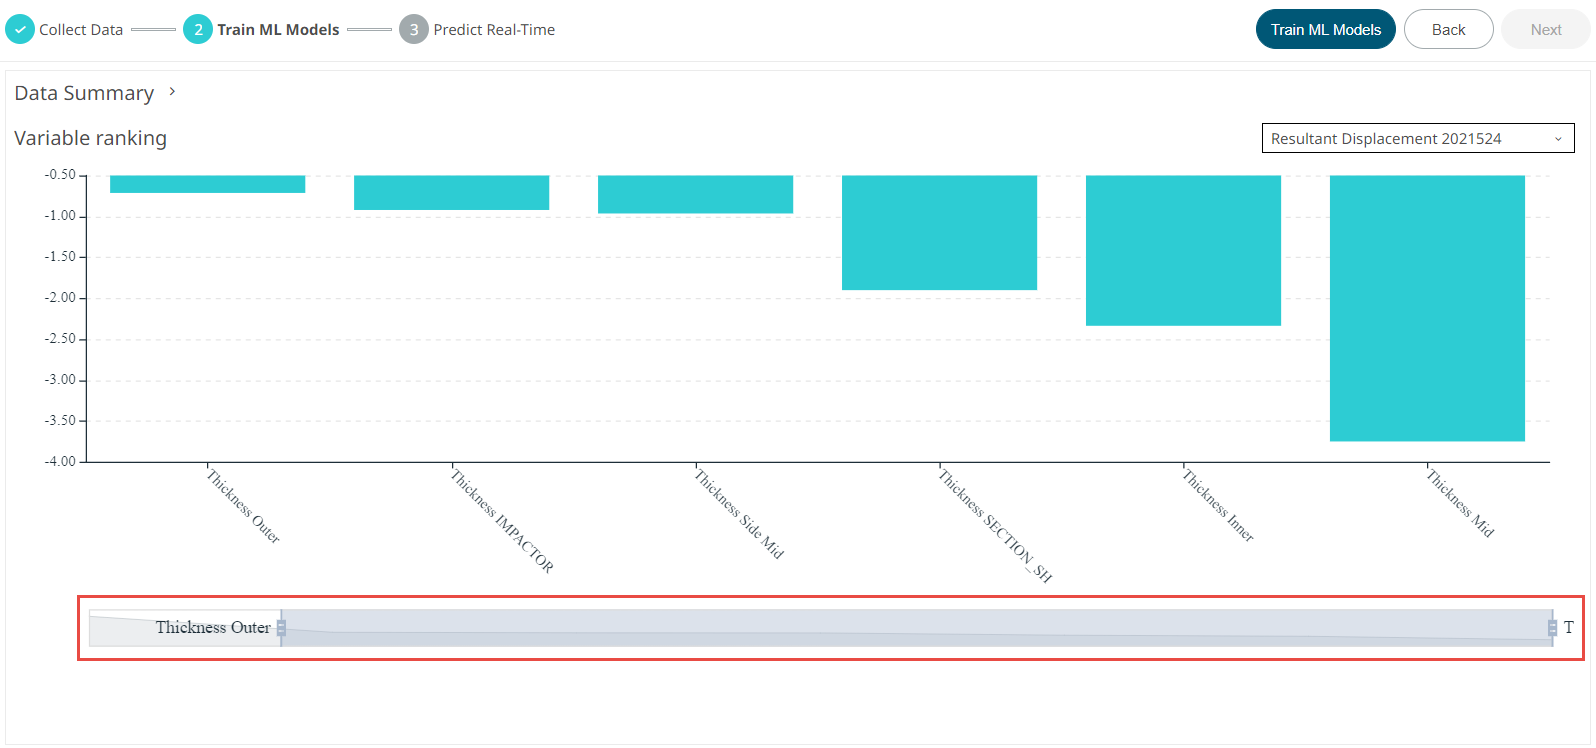
Figure 4. Variable Ranking Slider -
Click Train ML Models.
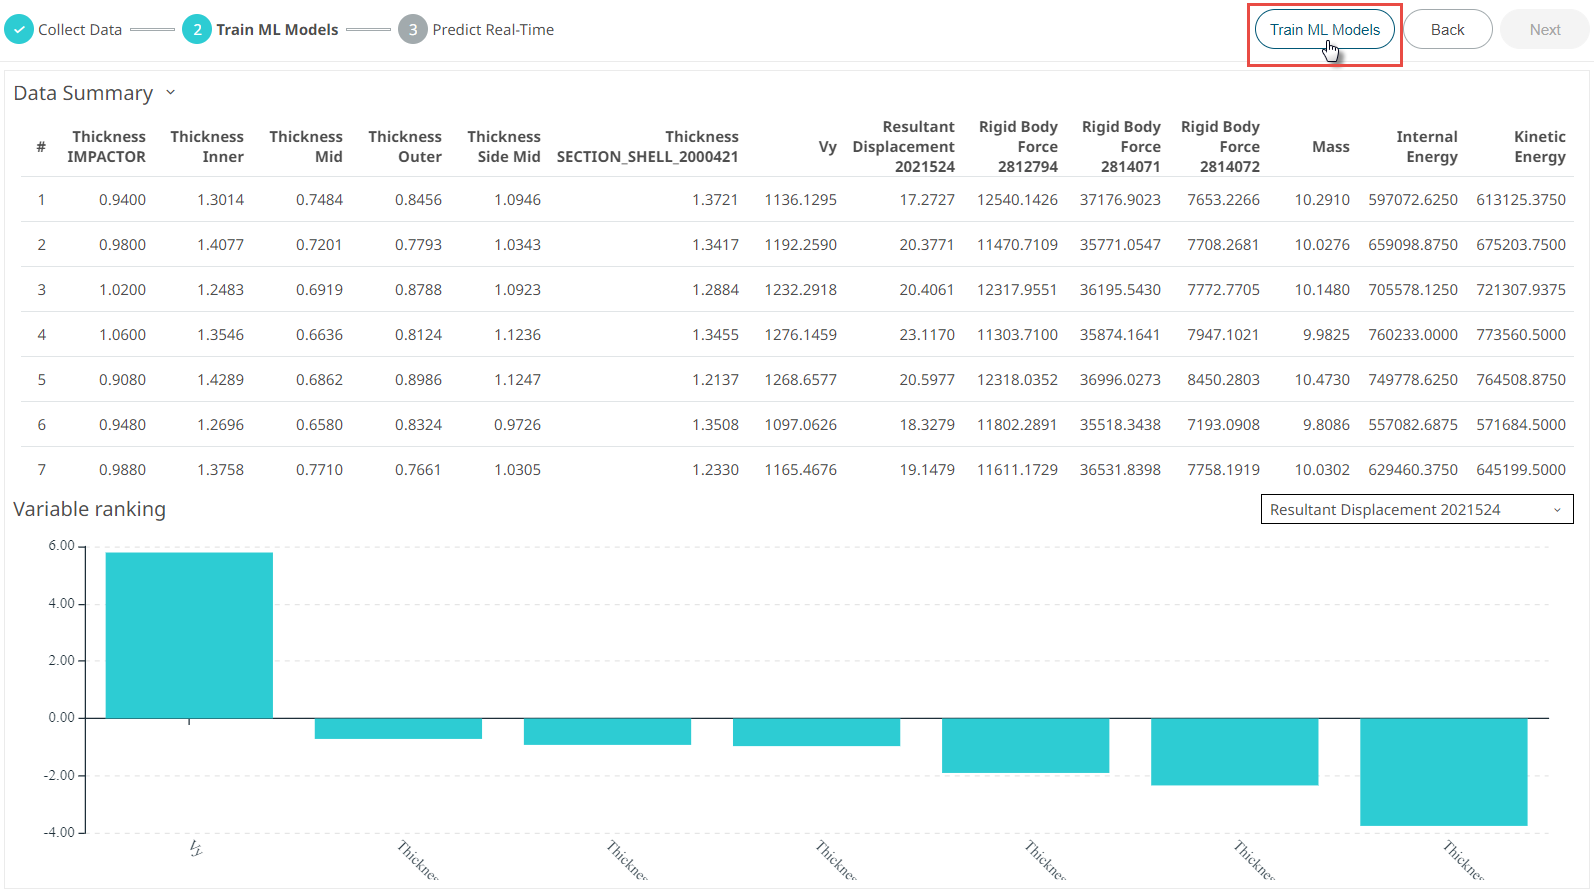
Figure 5. Train ML ModelsIn the train ML model step, multiple ML models are trained in the background with different settings and the best one is used in the next step-Predict Real Time.The Train ML Models stage of the simulation is complete.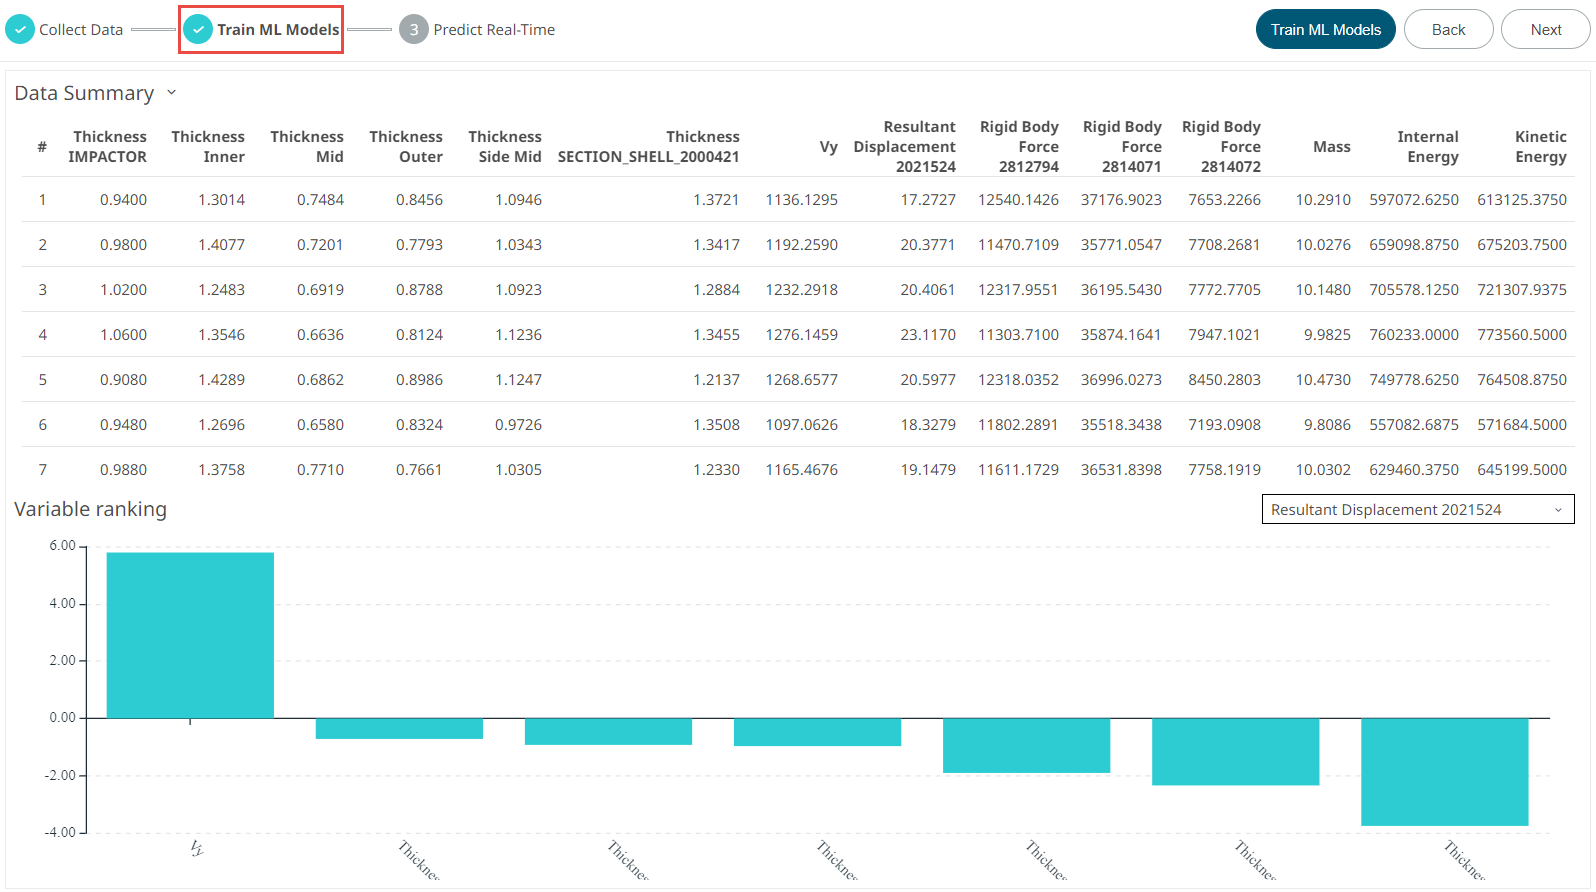
Figure 6. Train ML Models Stage Complete