Predict Real-Time
Predict real-time output value by changing the input value.
Predict real-time output values by changing the input values using the What-If analysis method.
-
Click Next to view the Model Quality values.
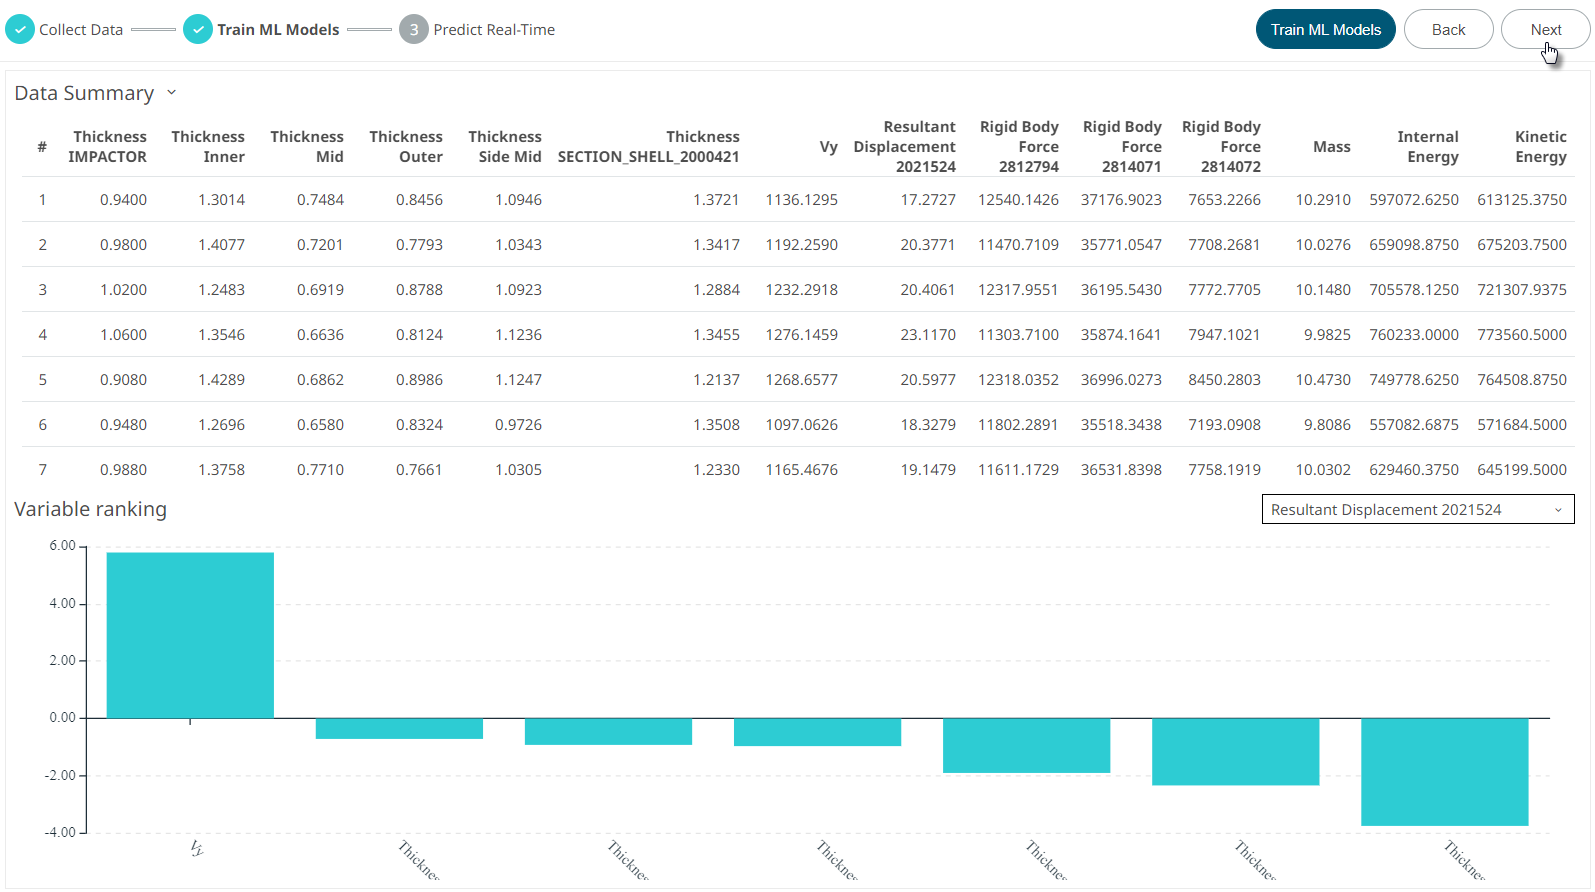
Figure 1. Predict Real-TimeThe Model Quality and What-If values are displayed.In model quality, a measure of ML model, R2, is displayed for train, cross-validation and test data. The closer it is to 1.0; the better the model is in predicting the known data points. R-square values in the Test column are better indications of the ML model quality but in the absence of a separate test data; R-Square values in the cross-validation column can be used as cross-validation provides a form of testing in the absence of a separate test data. Before you proceed with what-if studies or optimization; you should make sure that the R-square values in test or cross-validation are within acceptable ranges (i.e., greater than 0.7).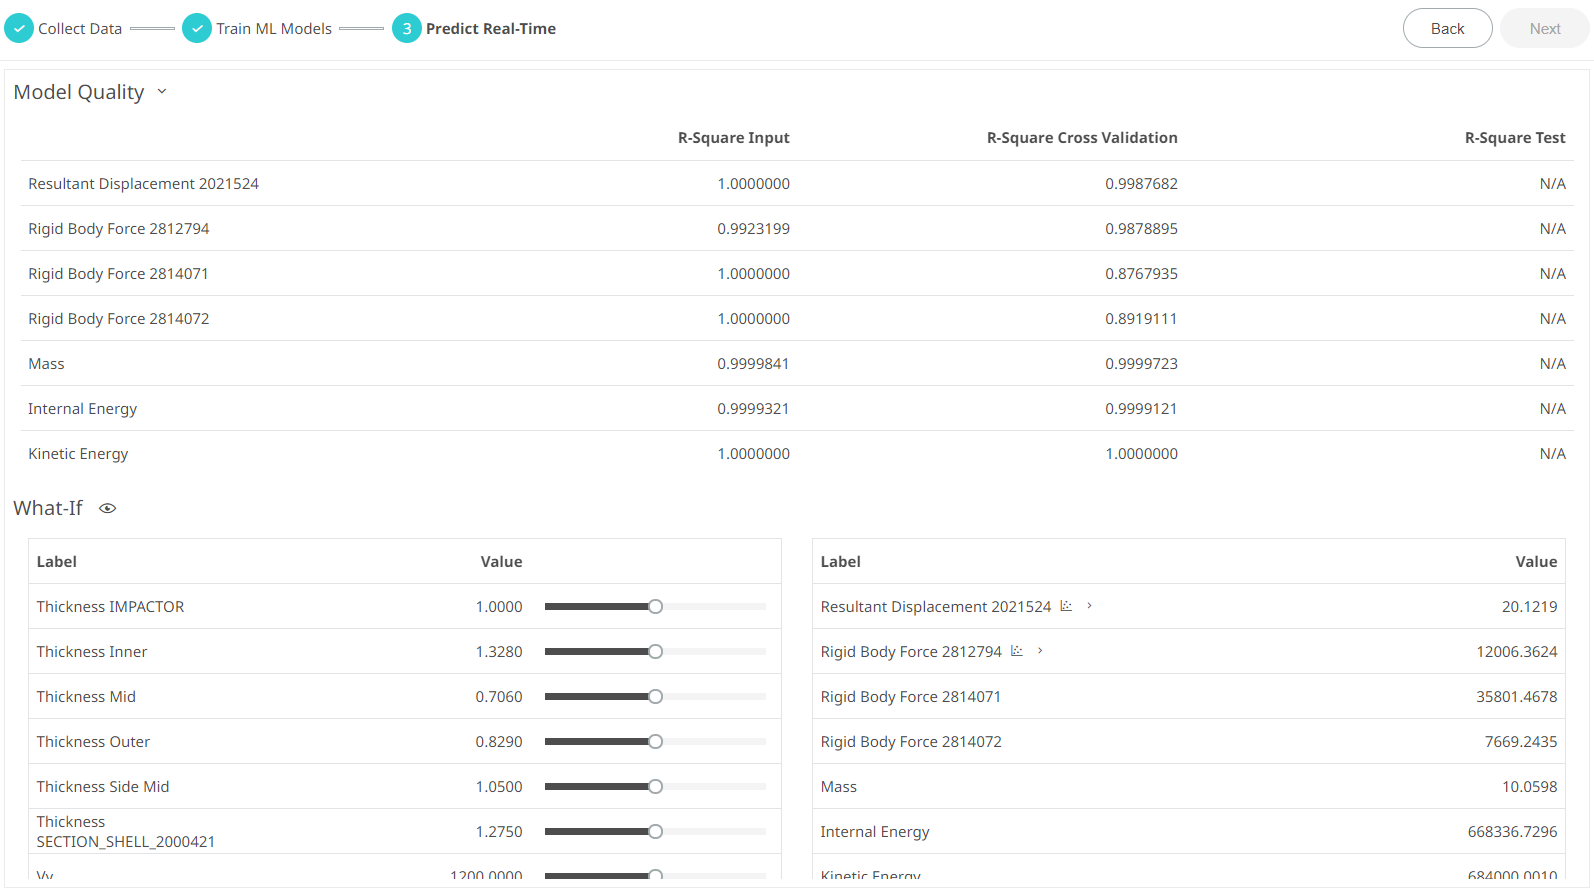
Figure 2. Model Quality and What-If Values -
Change the values of the input values in the What-If
panel to predict real-time output values.
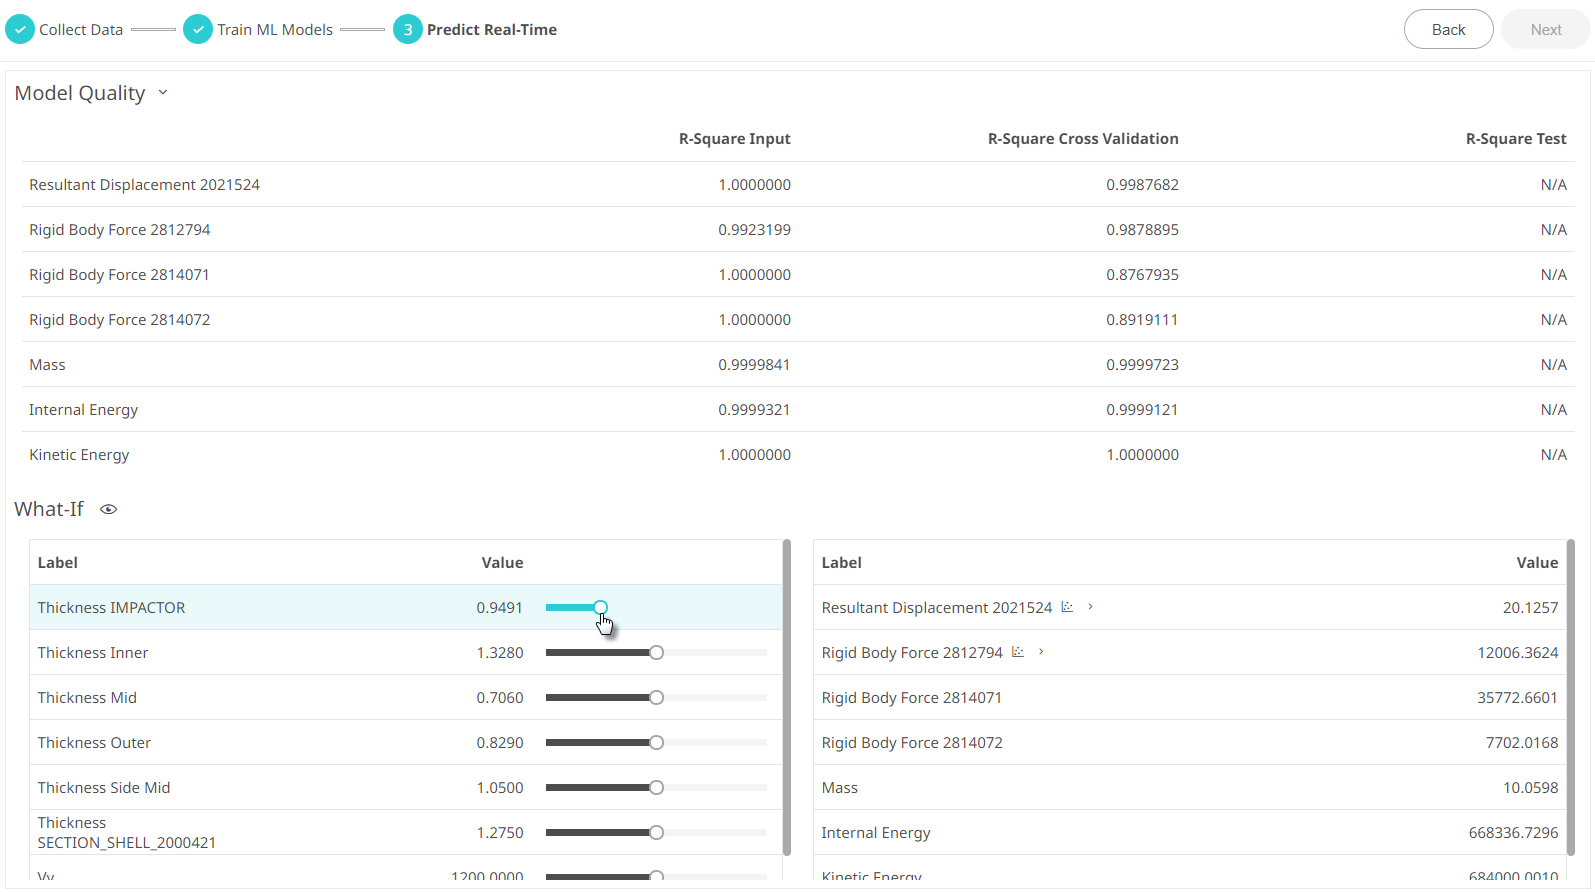
Figure 3. Predict Real-Time ValuesThe values of the output are updated by the ML model once the input values are changed.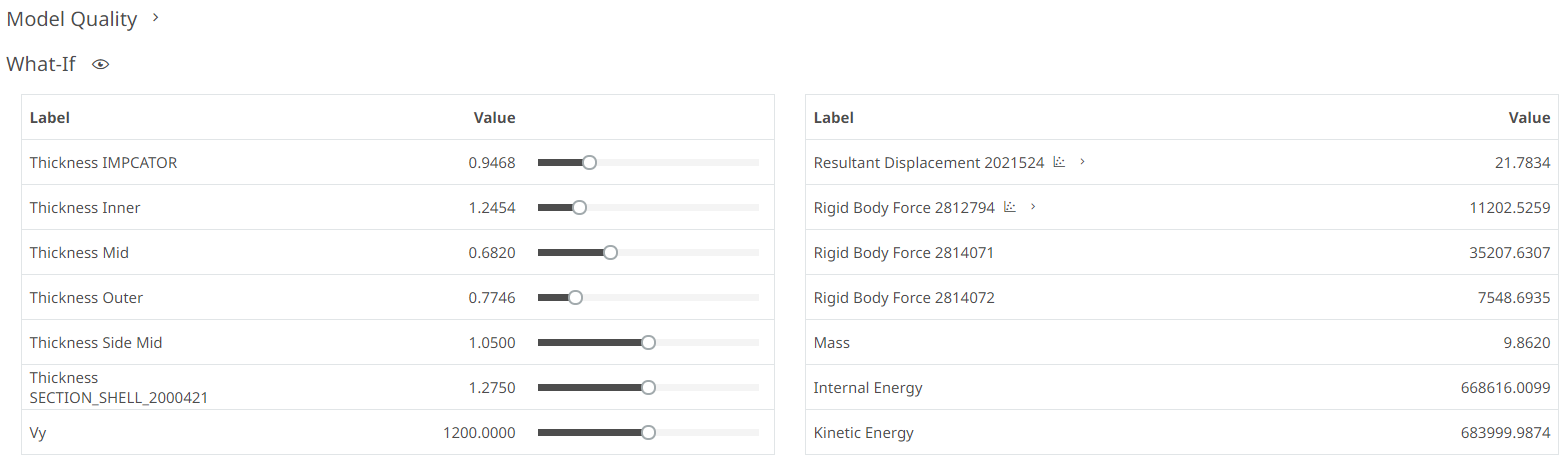
Figure 4. Predict Real-Time Changed Values -
Click
 in the output to display the
curve.
in the output to display the
curve.
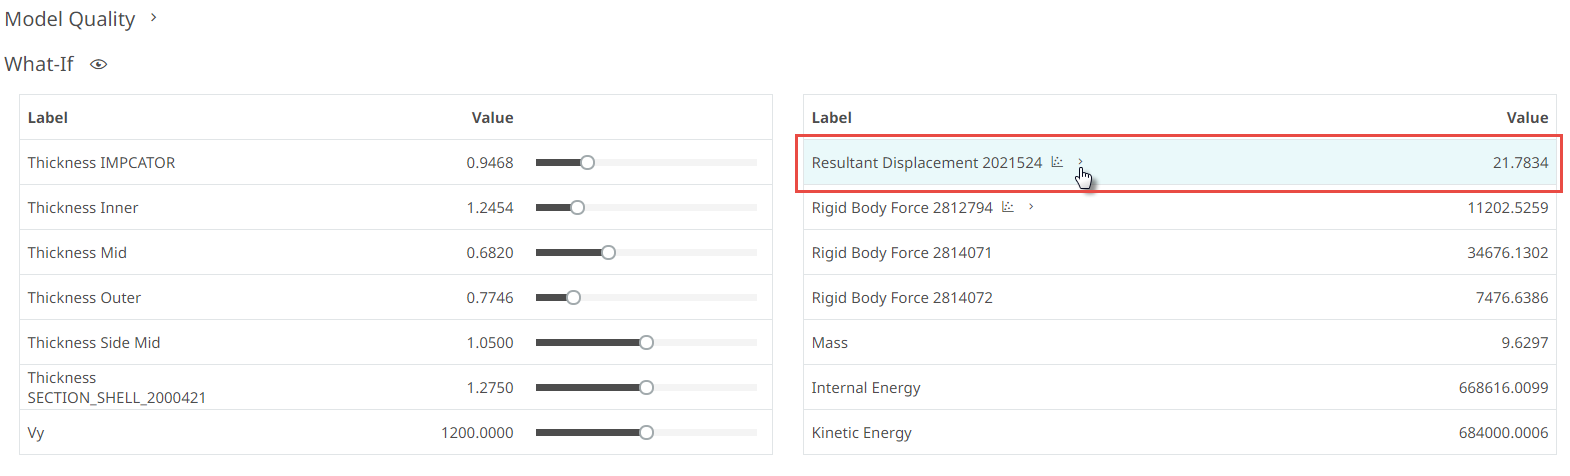
Figure 5. Curve PredictionThe curve for the output is displayed.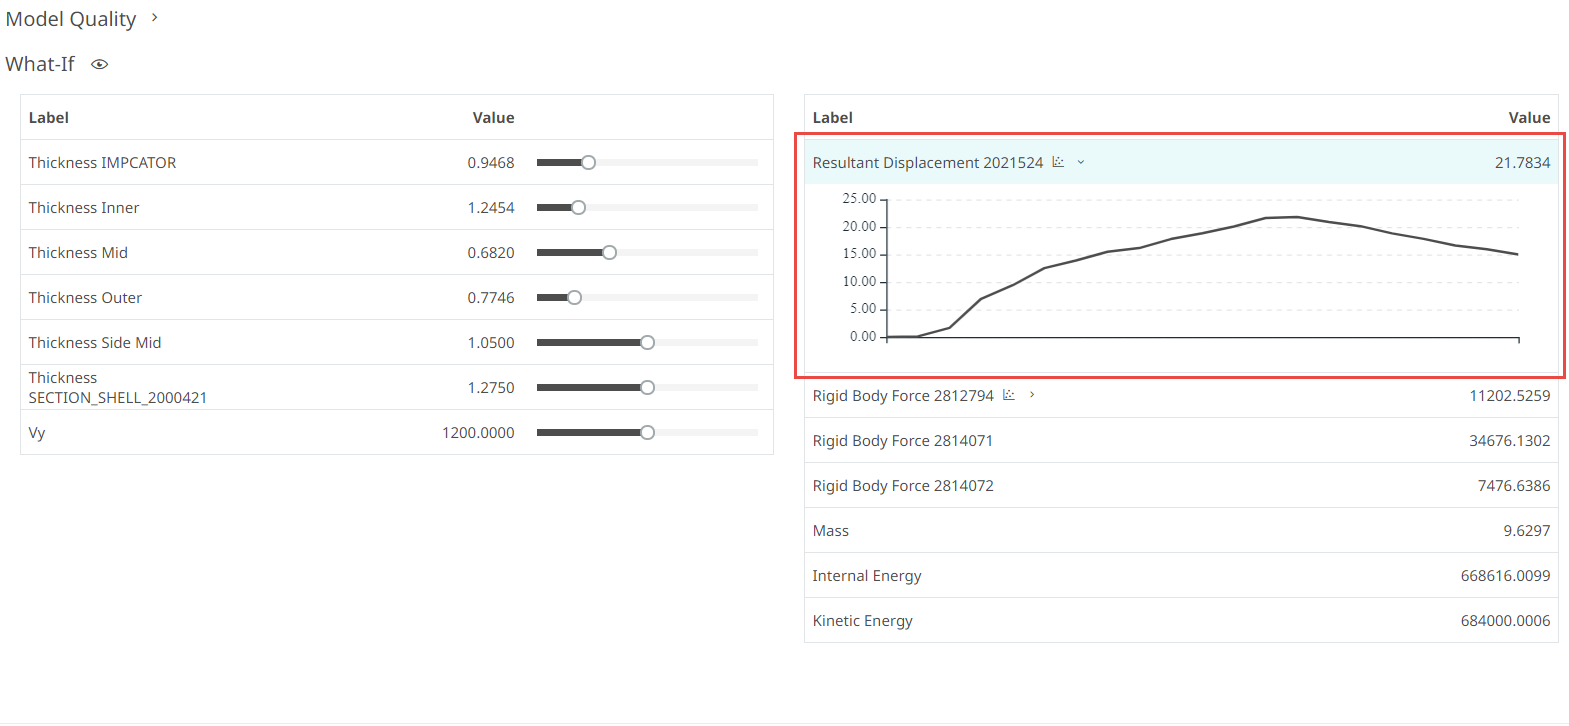
Figure 6. Output Curve -
Click
 to view the simulation model.
Note that this is available for displacements.The simulation model information is displayed.
to view the simulation model.
Note that this is available for displacements.The simulation model information is displayed.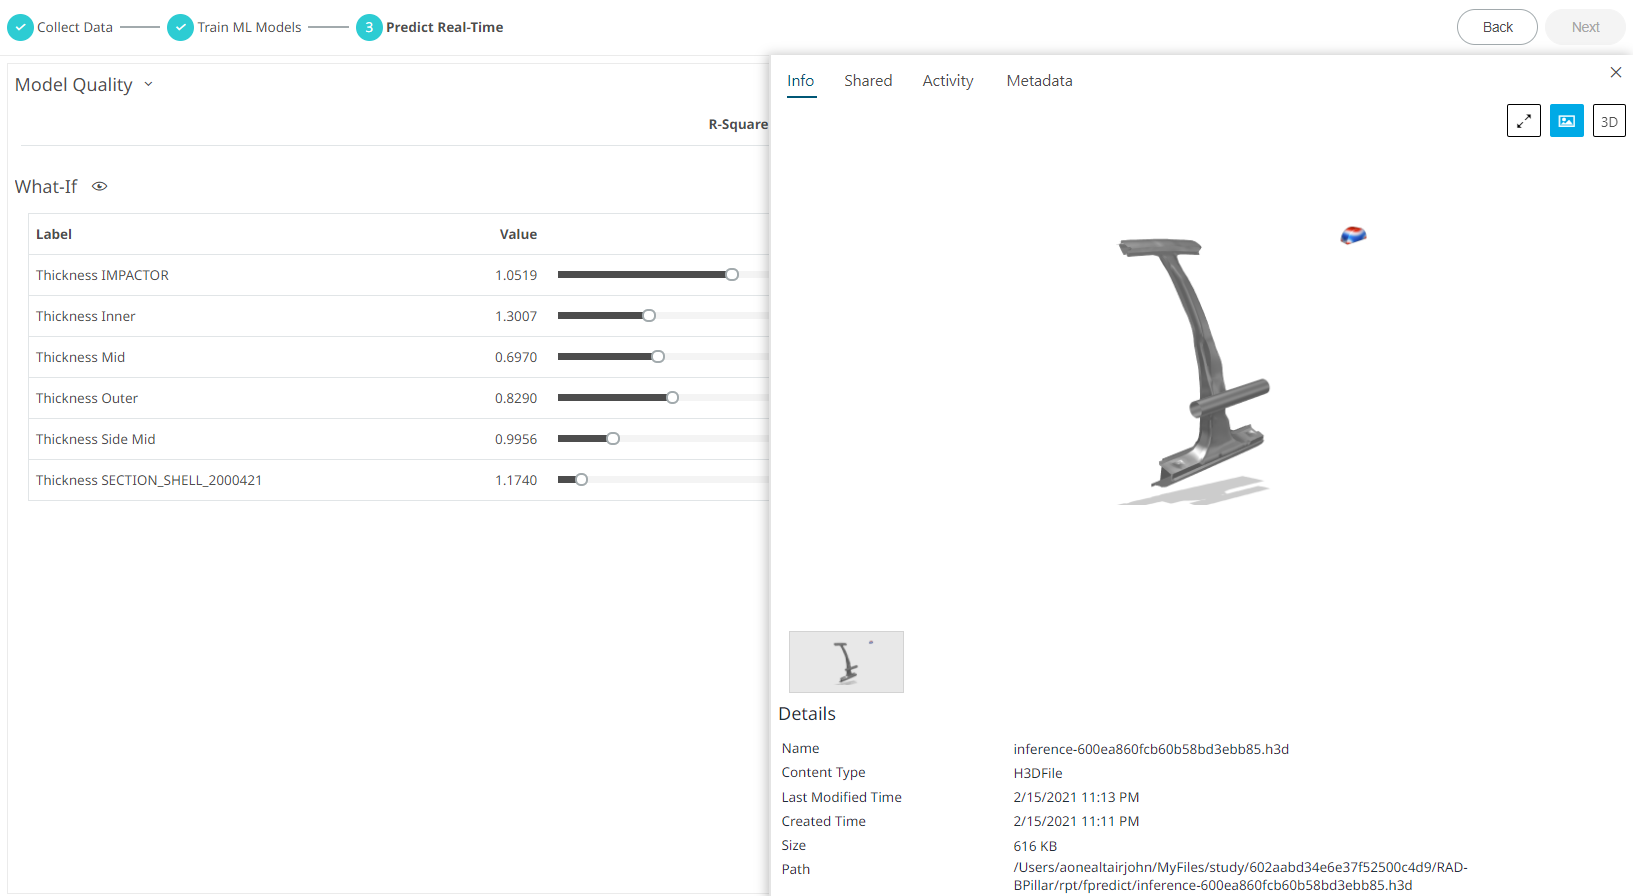 Figure 7. Simulation Model
 -
Click
 to view the 3D Model.
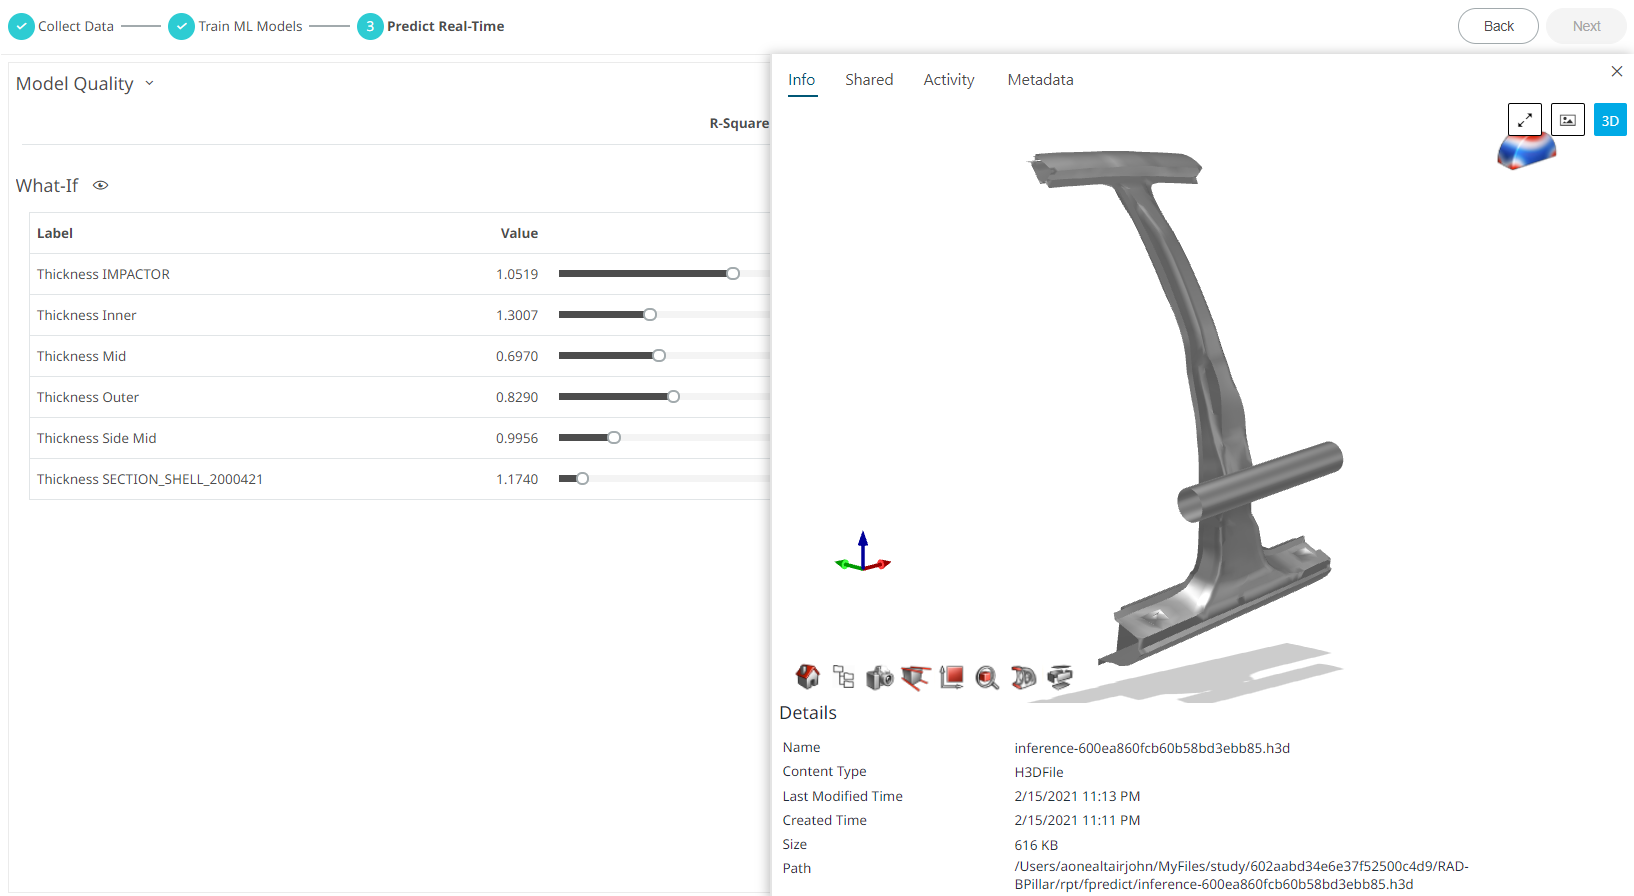 Figure 8. Simulation Model - 3D View
 -
Click
 to view the result contour plot.
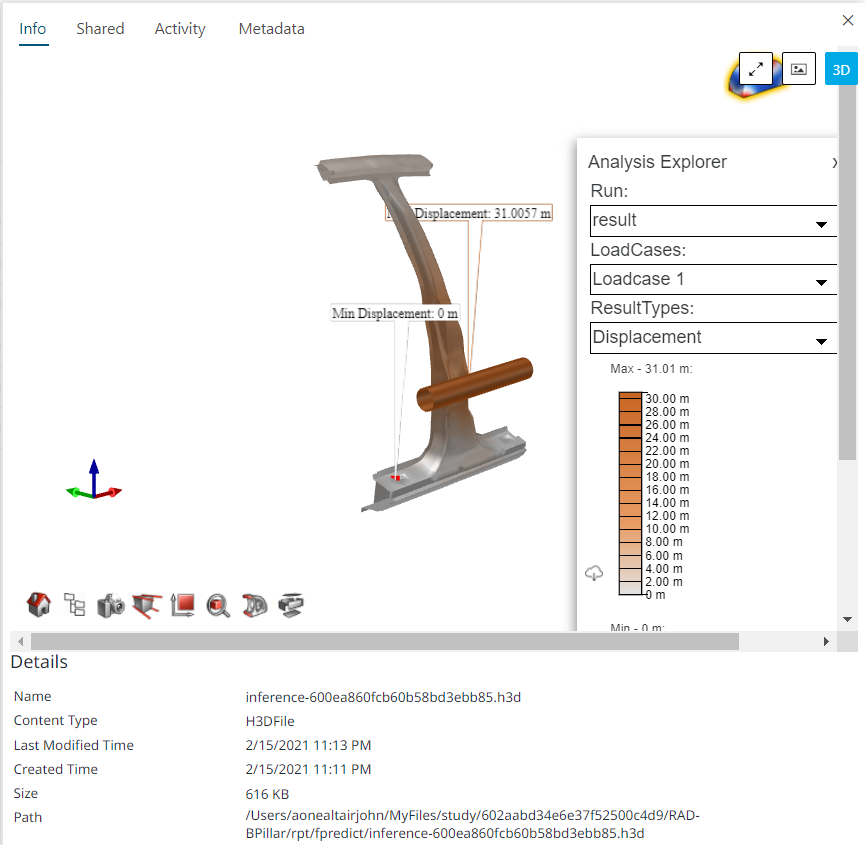
Figure 9. Simulation Model - 3D Contour View