Collect Data
Collect data for the simulation using the input file.
Download and use the sample Radioss file (BPillar_Input_Files.zip) to try the DesignAI workflow.
-
Login to Altair One.
Altair One home page is displayed.
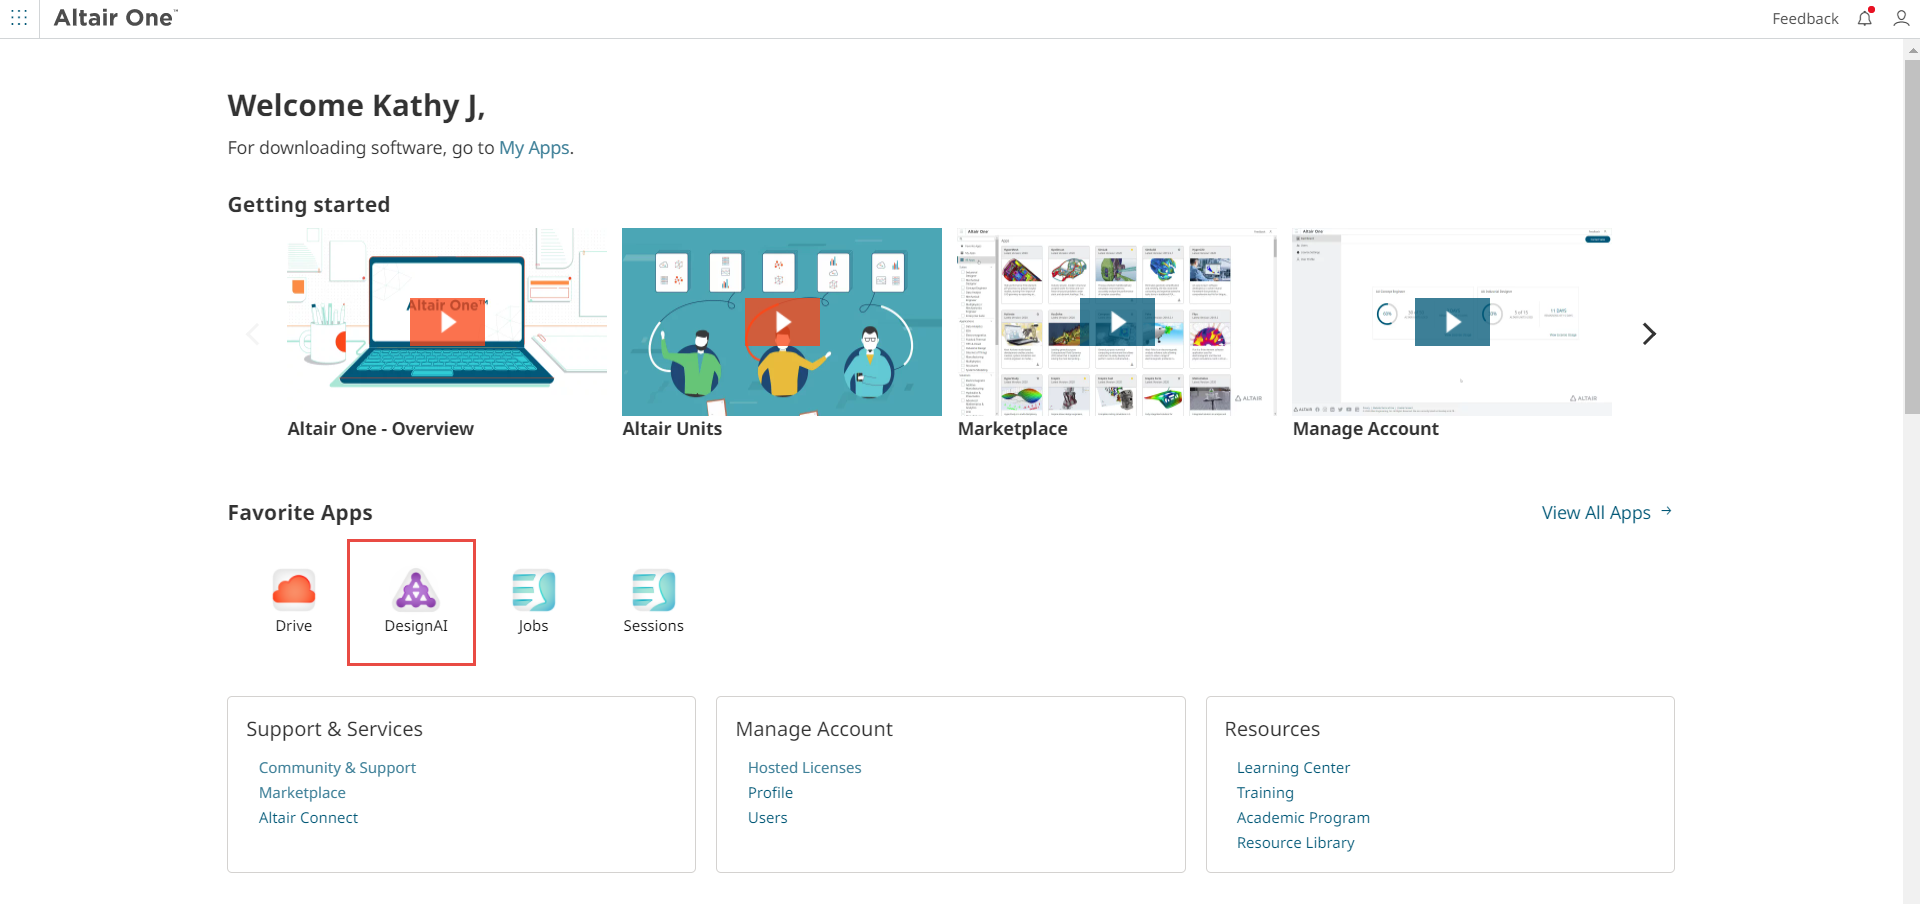
Figure 1. Altair One Homepage -
Click DesignAI in the Favorite
Apps.
The DesignAI page is displayed.
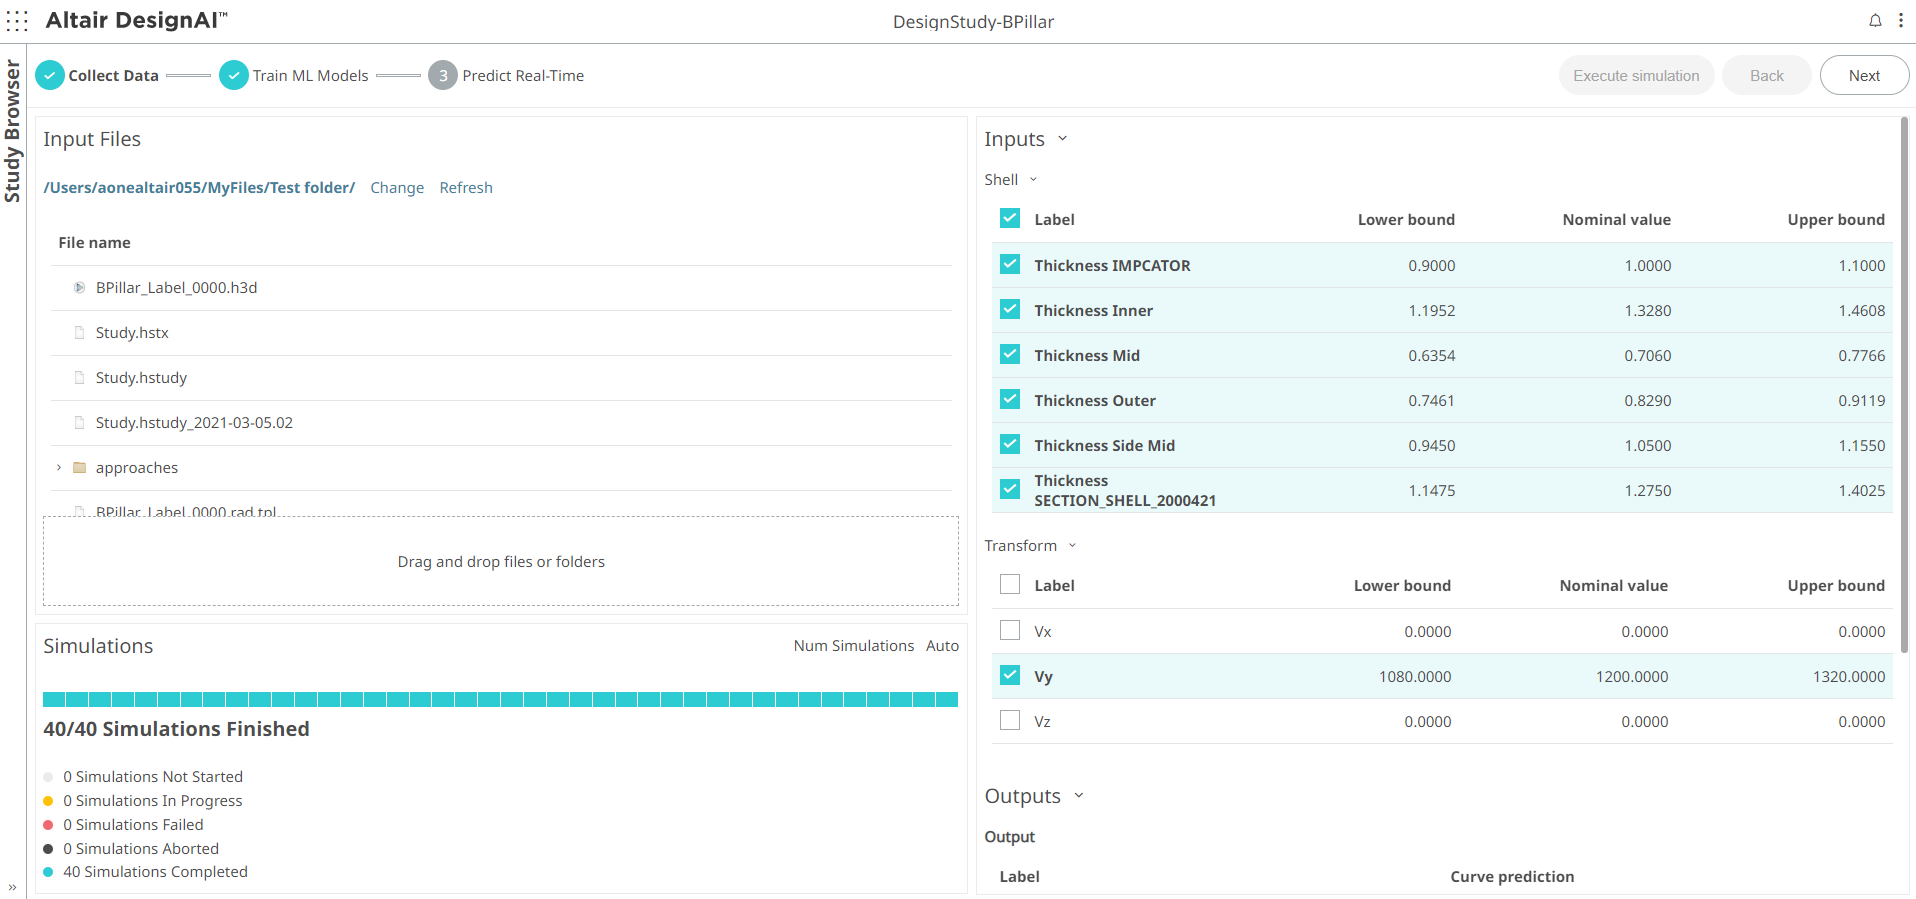
Figure 2. DesignAI PageThe DesignAI page displays the Study Browser on the left and Design Study Workflow on the right.
-
Click the
 at the bottom of the left pane to
display the list of DesignAI study files.
The Study Browser with the list of DesignAI study files is displayed.
at the bottom of the left pane to
display the list of DesignAI study files.
The Study Browser with the list of DesignAI study files is displayed.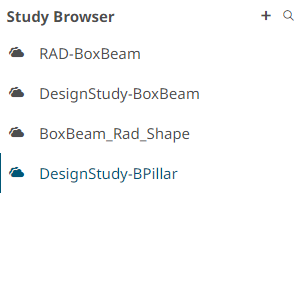
Figure 3. Study Browser -
Click
 to create a folder.
A New Study 1 folder is created.
to create a folder.
A New Study 1 folder is created.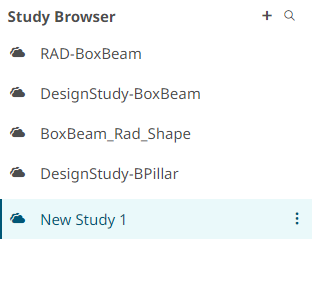
Figure 4. Study Folder Create -
Double-click the folder name New Study 1 to rename the
folder name.
Figure 5. Folder Name -
Drag and drop the input file or a folder.
The input file that is uploaded is displayed in the Input Files panel.
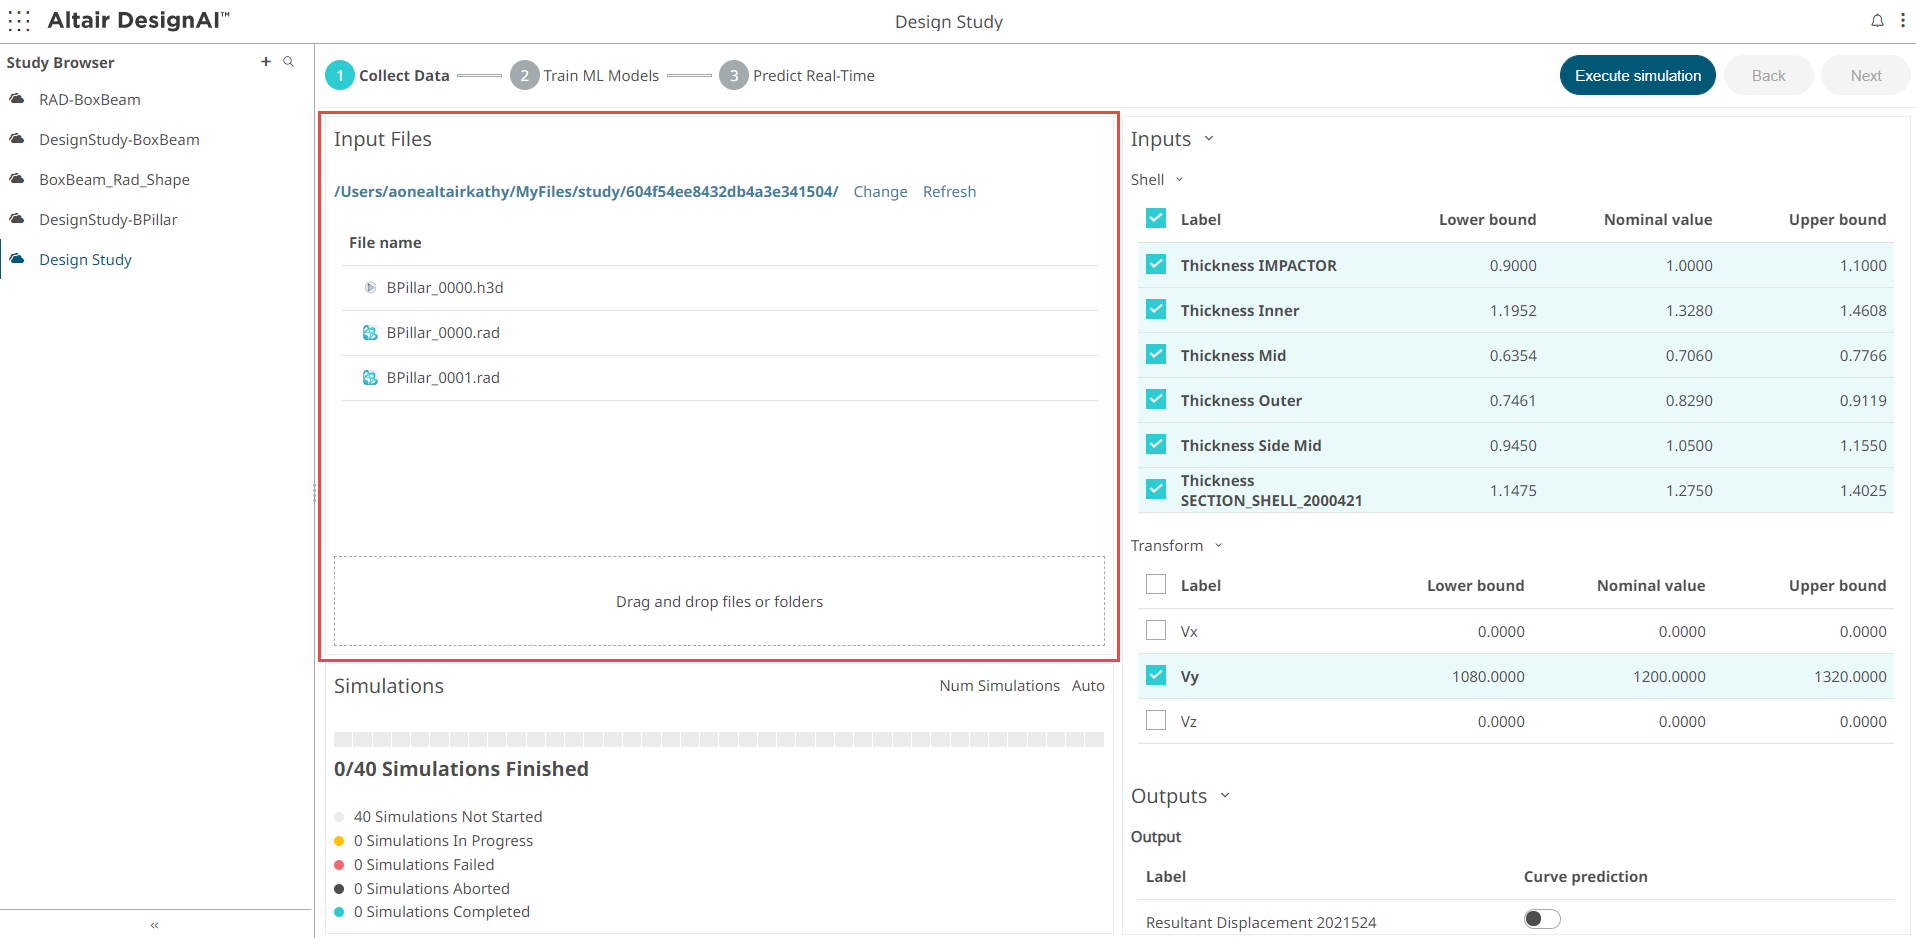
Figure 6. Input File for Design StudyDesignAI parses the input file, extracts, and displays the inputs and outputs of the model.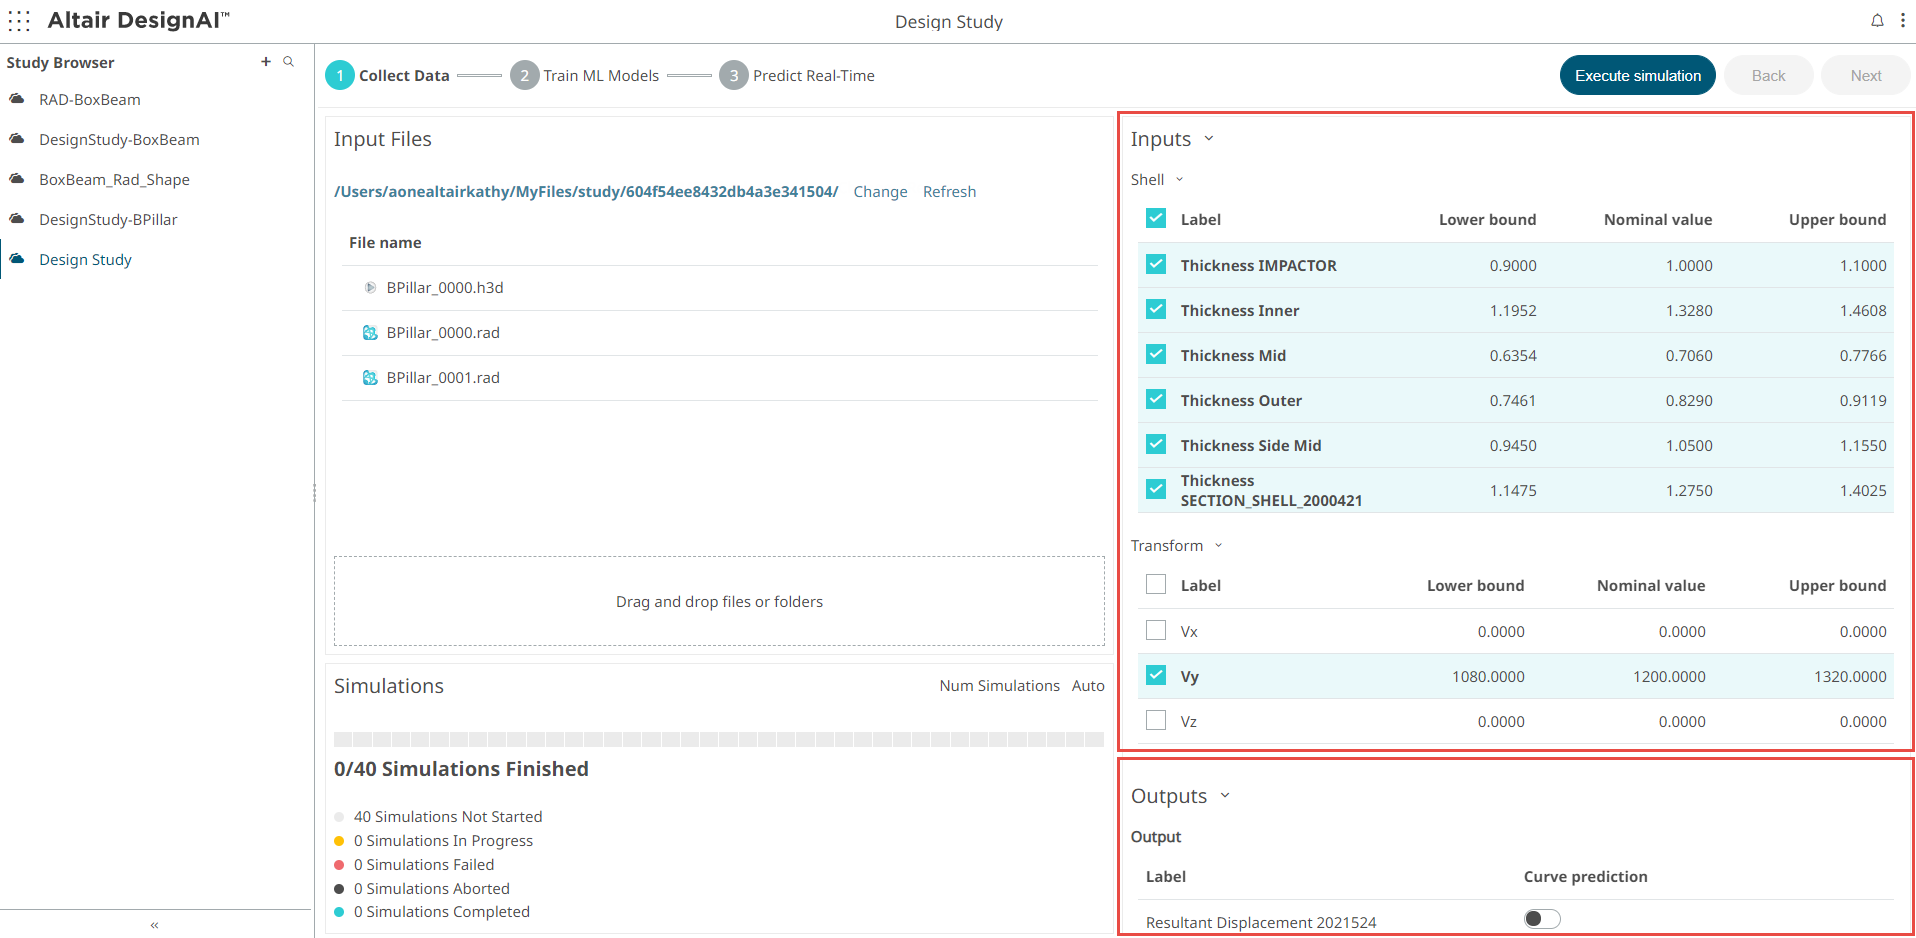
Figure 7. Model Input File -
All the inputs are selected by default. Click the checkbox next to an input to
exclude it from the simulations.
The inputs from the model file are displayed in this pane. Nominal value corresponds to the values in the input file. Lower and upper bounds for Shell Thicknesses are calculated as +-10% while the lower and upper bounds for Shapes are by default -1, 1. You can change these values by double clicking on them. You can also unselect some of the inputs for the dataset. Based on the selected inputs, the number of simulations that will be performed is displayed in the Simulations panel.
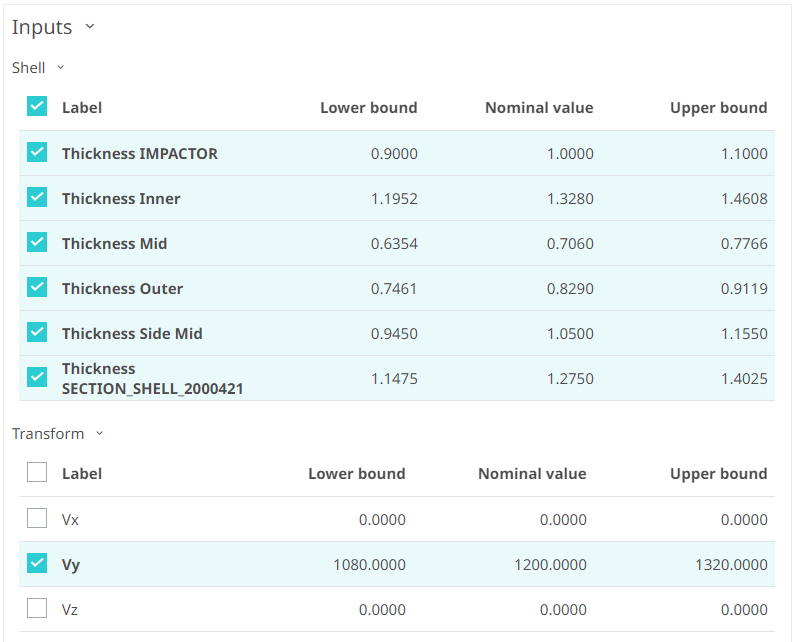
Figure 8. Inputs PanelThe Simulations panel displays the simulations progress and its status. By default, the number of simulations is automatically calculated based on the number of inputs selected by the user. This can be changed by editing the Auto field in this panel. Note that higher values will increase the training dataset, potentially improving the ML model. It is not suggested using less than the Auto value as this will decrease the quality of the ML model.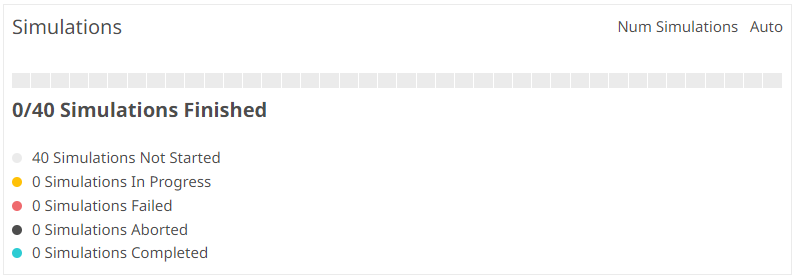
Figure 9. Simulation Cycle -
To enable the curve prediction of an output, toggle the switch of the output to
the right.
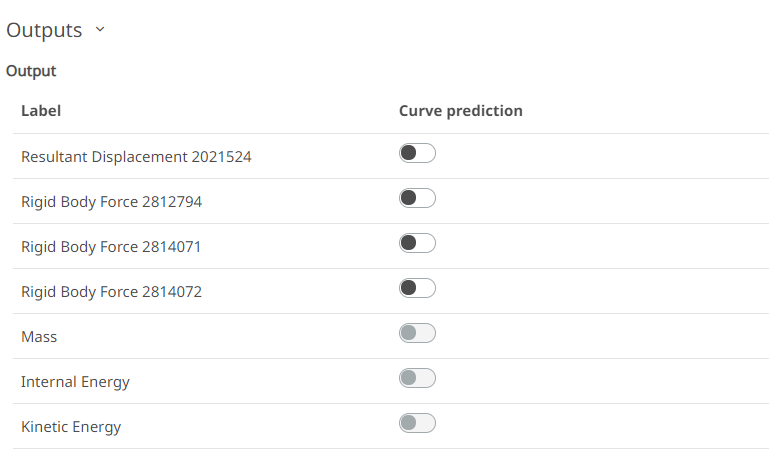
Figure 10. Enable Curve Prediction -
Click Execute Simulation.
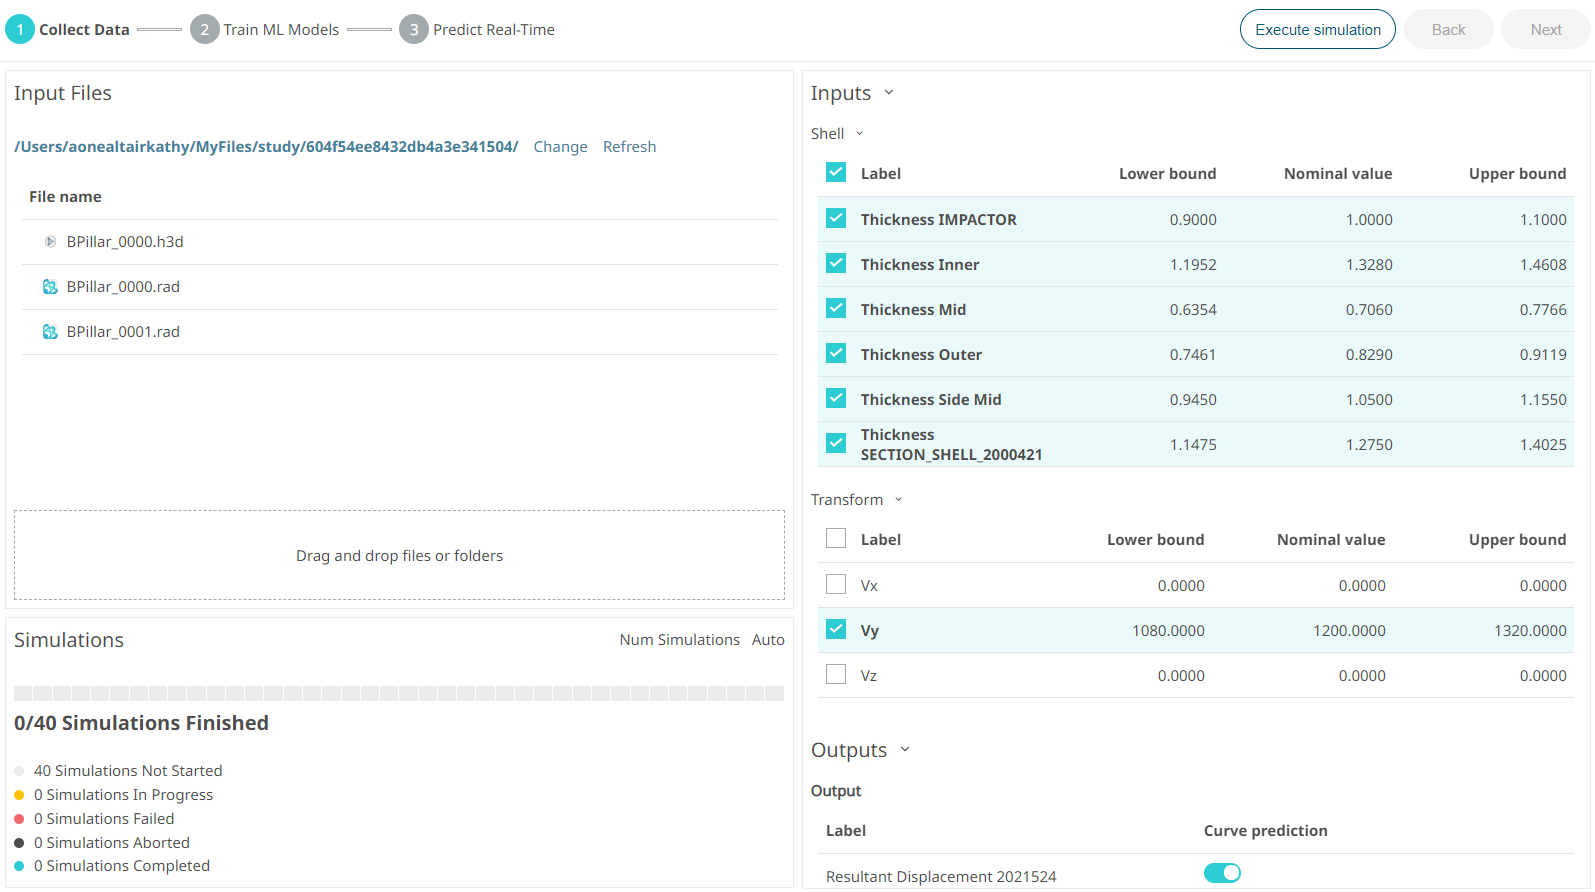
Figure 11. Execute SimulationNotifications are provided at the top displaying the progress of the simulation. Click to check more information about the simulation
progress.The Simulations panel also displays the progress of the simulations.
to check more information about the simulation
progress.The Simulations panel also displays the progress of the simulations.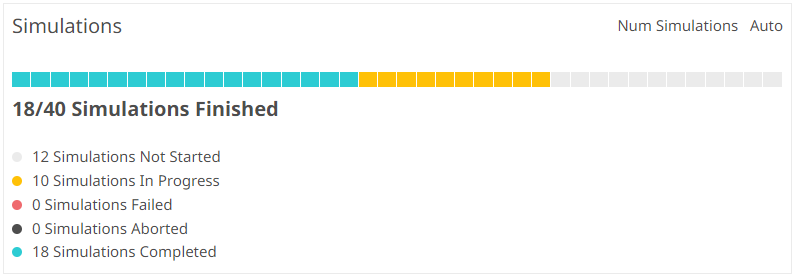
Figure 12. Simulation ProgressThe Collect Data stage of the simulation is complete, and the simulation files are displayed in the Input Files panel.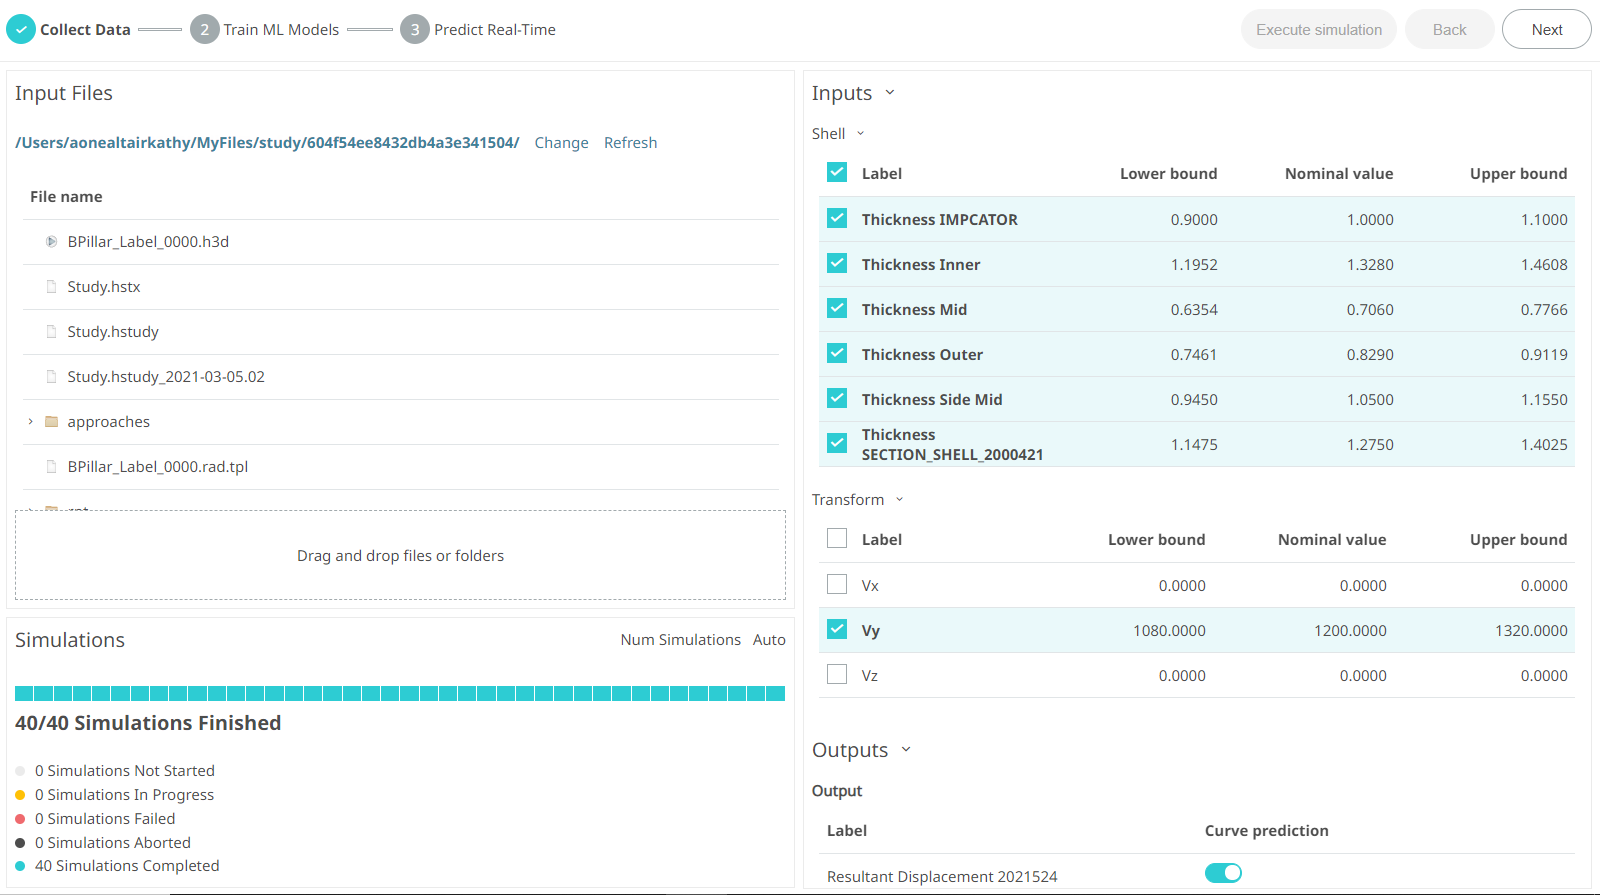
Figure 13. Collect Data Stage Complete