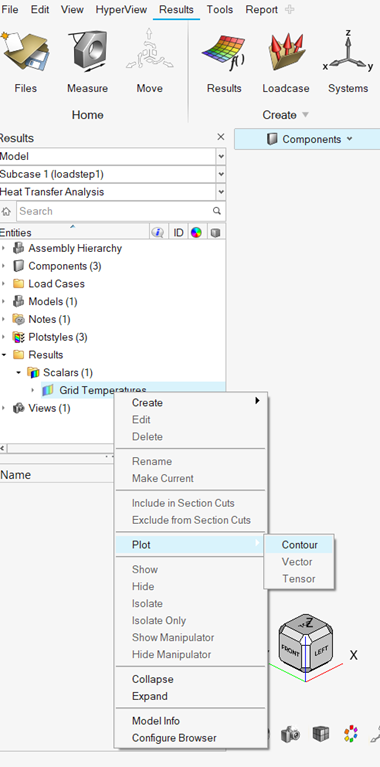
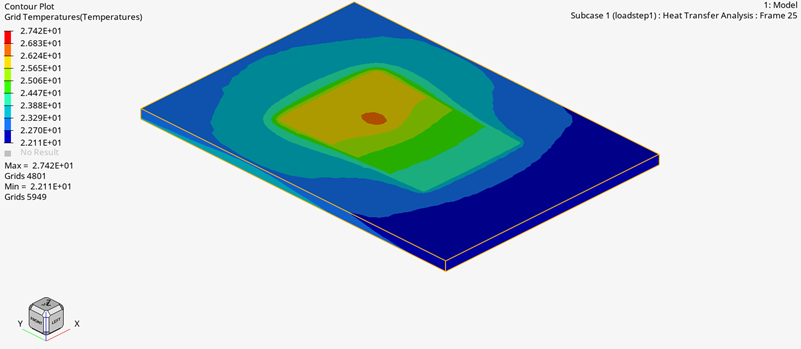
Plot Contour in HyperView Plot contour in HyperView. From the Results Browser, expand the Results > Scalars folders. Right-click Grid Temperatures and select Plot > Contour from the context menu. Figure 1. The contour displays in the modeling window. Figure 2. Contour Example