


|
Rank Filtering
Rank filtering only uses the leaf item of the breakdown when creating the ranking. Consequently, this makes the number of items consistent, regardless of the hierarchy. Note that this behavior also applies to crosstabs.
Rank Filter is available in all non-time series visualizations that use the Size or Height variable:
q Bar Graph
q Bullet Graph – Horizontal & Vertical
q Categorical Line Graph
q Circle Pack
q Dot Plot
q Donut Chart
q Donut Gauge
q Funnel Chart
q Heat Map
q Map Plot
q Network Graph
q Pareto Chart
q Pie Chart
q Scatter Plot
q Treemap
q Waterfall Chart
It is also available in the Record and Table visualizations.
This section discusses the steps and guidelines to set the rank filtering using this sample data table.
Sample Data Table 1: SuperMarket
|
Region |
Area |
Type |
Amount Sold |
Revenue |
|
South West |
Ambient |
Store Cupboard |
4,885.00 |
550,697.00 |
|
South West |
Ambient |
Home Products |
2,314.00 |
323,094.00 |
|
South West |
Ambient |
Savoury |
840.00 |
67,702.00 |
|
South West |
Ambient |
Confectionary |
429.00 |
33,219.00 |
|
South West |
Ambient |
Tobacco |
1,975.00 |
712,467.00 |
|
South West |
Ambient |
Soft Drinks |
619.00 |
56,493.00 |
|
South West |
Ambient |
Chilled |
415.00 |
22,825.00 |
|
South West |
Cold & Frozen |
Frozen |
2,084.00 |
357,953.00 |
|
South West |
Cold & Frozen |
Chilled |
9,478.00 |
1,059,714.00 |
|
South West |
Cold & Frozen |
Frozen Ice Creams |
1,169.00 |
148,791.00 |
|
South West |
Alcohol |
Alcohol |
2,916.00 |
1,170,043.00 |
|
Wales |
Ambient |
Store Cupboard |
3,151.00 |
352,862.00 |
|
Wales |
Ambient |
Home Products |
1,450.00 |
191,889.00 |
|
Wales |
Ambient |
Savoury |
487.00 |
39,249.00 |
|
Wales |
Ambient |
Confectionary |
150.00 |
8,870.00 |
|
Wales |
Ambient |
Soft Drinks |
337.00 |
29,761.00 |
|
Wales |
Ambient |
Tobacco |
1,267.00 |
454,652.00 |
|
Wales |
Ambient |
Chilled |
321.00 |
17,655.00 |
|
Wales |
Cold & Frozen |
Frozen |
1,332.00 |
226,840.00 |
|
Wales |
Cold & Frozen |
Chilled |
6,316.00 |
702,994.00 |
Other settings on the Treemap visualization:
|
Breakdown |
Size |
Color |
|
Type, Area, Region |
Amount Sold |
Revenue |
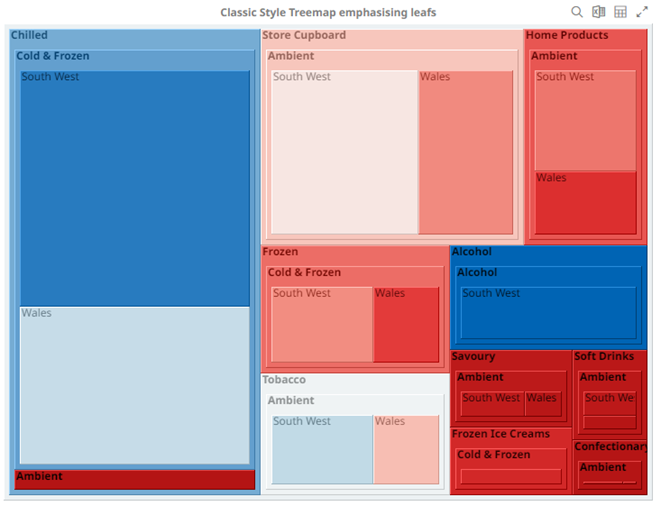
Sample visualization: Treemap before the rank filter
Steps:
1. Click on a snapshot visualization and then click the Filters drop area on the Visualization Settings pane.
The visualization filter properties are displayed.
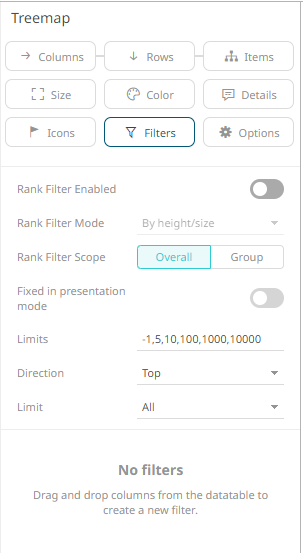
2. Tap the Rank Filter Enabled slider to turn it on.
The Rank Filter Mode drop-down list is enabled.
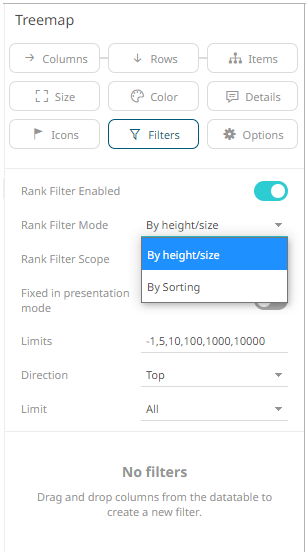
3. Select either of the Rank Filter Mode:
· By Height/Size
Allows the visualization to be ranked based on the Size or Height variable.
· By Sorting
Allows the visualization to be ranked based on the top values of the Size or Height variable.
4. Select either of the Rank Filter Scope:
· Overall
For the flat rank, including all of the existing leaf nodes.
· Group
For the per inner node rank of leaf nodes under the same inner node.
5. Enter the value of the Limits.
Default values are -1,5,10,100,1000,10000.
For example, the values are set to -1,10,100,1000.
These limits can be selected either:
· in the Limit drop-down list in the visualization
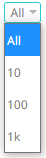
· on the Filter Settings pane
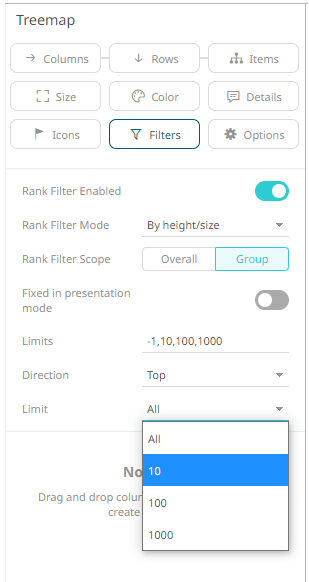
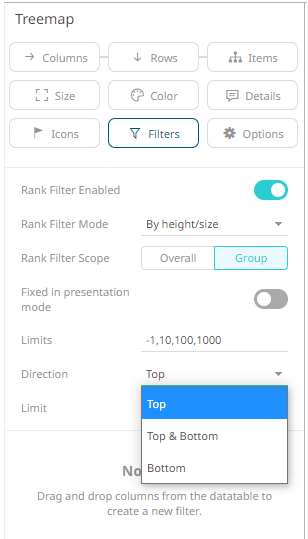
6. Select the ranking Direction that can be selected either:
· in the Direction drop-down list in the visualization
· on the Filter Settings pane
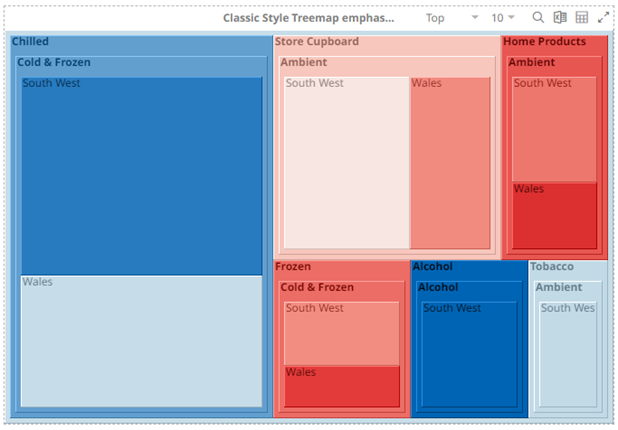
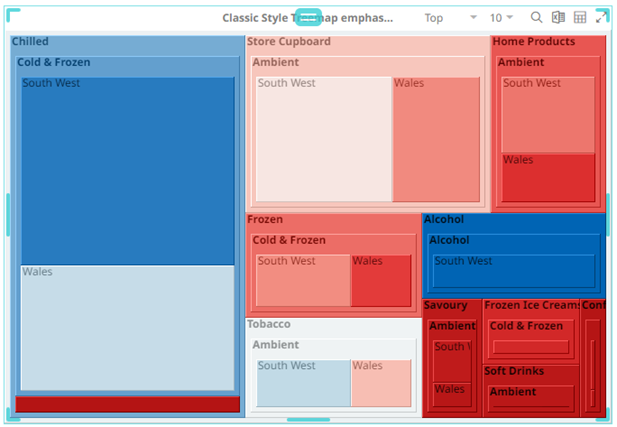
Example 1: Selecting the Height/Size mode, Overall scope, Top direction, 10 as the limit, and Amount Sold as the Size variable.
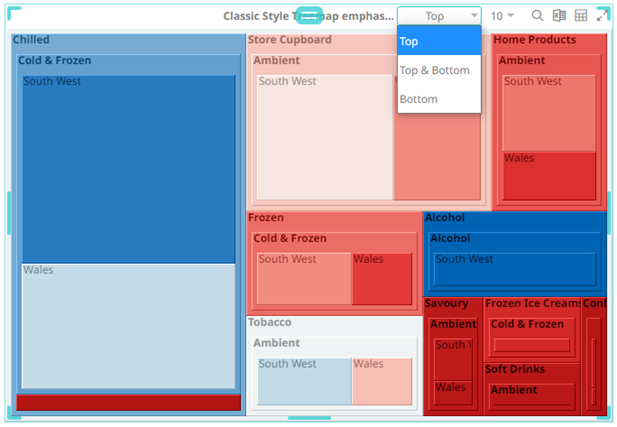
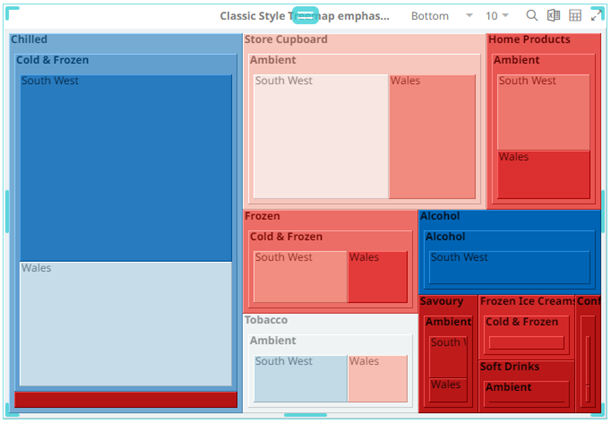
Example 2: Selecting the Height/Size mode, Group scope, Top direction, 10 as the limit, and Amount Sold as the Size variable.
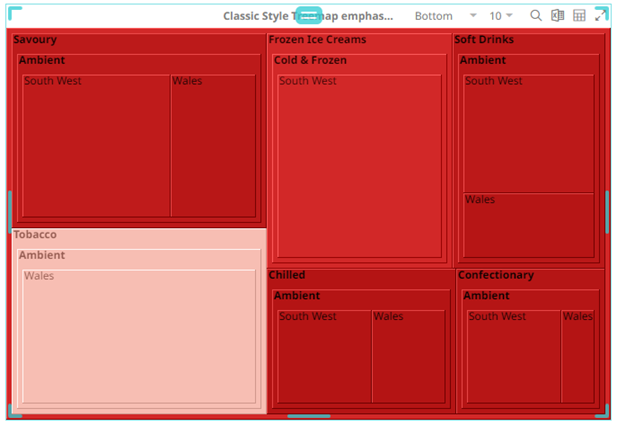
Example 3: Selecting the Height/Size mode, Overall scope, Bottom direction, 10 as the limit, and Amount Sold as the Size variable.
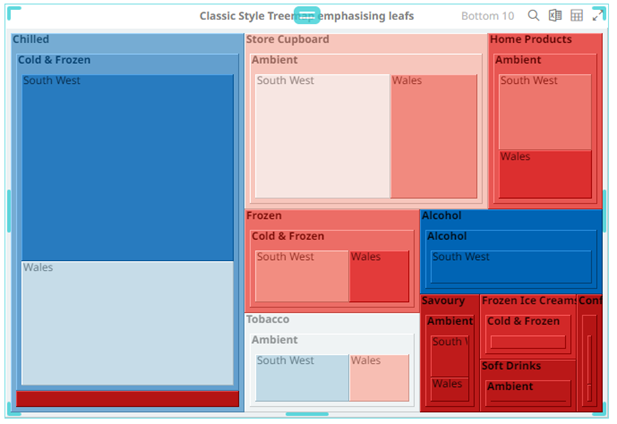
Example 4: Selecting the Height/Size mode, Group scope, Bottom direction, 10 as the limit, and Amount Sold as the Size variable.
7. Tap the Fixed in Presentation Mode slider to turn it on.
This disables the drop-down lists in the visualization. Only the labels of the options are displayed:
6. Click
the Save  icon.
icon.
When
saved, the  notification
is displayed.
notification
is displayed.