


|
Record Graph Settings
A record visual is effectively a transposed table and can be used to display the metrics for one, or a few individual records (or aggregated records).
Like the table, metrics are added to “Visual Members”, but correspond to rows in the record (rather than columns in a table).
Row cells display their text value which may wrap into multiple lines.
Text can be colored either with a background or foreground.
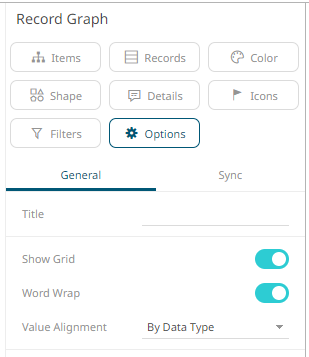
The record
graph settings pane is displayed after clicking the Options  button.
|
Setting |
Description |
|
Show Grid |
Determines whether grid lines are visible or not. |
|
Word Wrap |
Determines whether to wrap the text. |
|
Value Alignment |
Alignment of the value: · By Data Type · Left · Center · Right |