|
X & Y Variables Configuration
The X and/or Y variables are available in Bar Graph, Box Plot, Bullet Graph, Categorical Line Graph, Dot Plot, Numeric Line Graph, Numeric Needle Graph, Numeric Stacked Needle, Scatter Plot, Scatter Plot 3D, Surface Plot, Surface Plot 3D, Waterfall Chart, Candle Stick Graph, Stacked /Grouped Needle Graph, Horizon Graph, Line Graph, Needle Graph, OHLC Graph, Order Book, Pareto Chart, Price Band, Spread Graph, Stack Graph, Timeseries Scatter Plot, Timeseries Surface Plot visualizations.
The configuration pane for X & Y Variables is the same as for the Size variable.
|
NOTE |
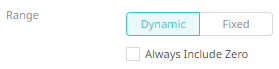
For most of the visualizations with numeric axis, you can set the visible range for the Y and/or Y variable which can either be calculated dynamically (the default, enabled Dynamic).
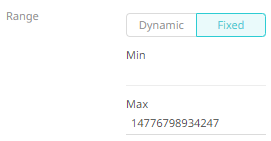
Check Always Include zero box to let the axis scale start at Zero, and grow to any number that may show up in the data. Or set between predefined limits by clicking Fixed. This displays the Min and Max text boxes that are populated with the default values taken from the data set.
|