Learn how to fit a polyNURBS to a smoothed result.
In this lesson you will learn how to:
View and smooth an optimized shape
Generate CAD by fitting a PolyNURBS to the smoothed result
Modify the CAD to better contact the non-design spaces
Analyze the modified shape and view the results
Open the Design Concept Model
Press F7 to open the Demo Browser.
Double-click the Analyze Design Concept.stmod file to load
it in the modeling window.
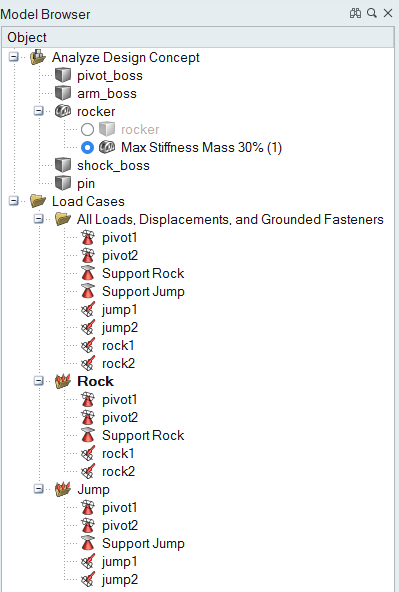
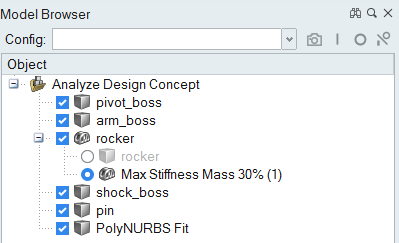
Press F2 to open the Model Browser. Verify that the
Max Stiffness Mass 30% result alternative is
selected.
Make sure the display units in the Unit System Selector are set to
MMKS (mm kg N s).
View and Refine the Optimization Results
Click the Structure tab on the ribbon.
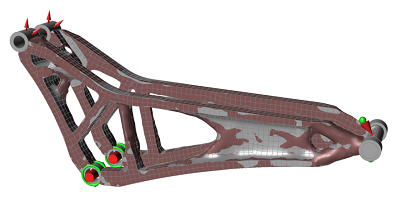
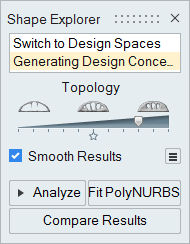
An optimization was previously run and saved with the model. Click
Show Optimization Results on the Optimize icon to
view the Shape Explorer, or simply double-click the optimized part.
Position the topology slider on the Shape Explorer two ticks from the far
right. This is the point at which the generated shape is fully connected, which
is important when fitting PolyNURBS to the result. Your analysis results and CAD
converstion will vary depending on where you position the slider.
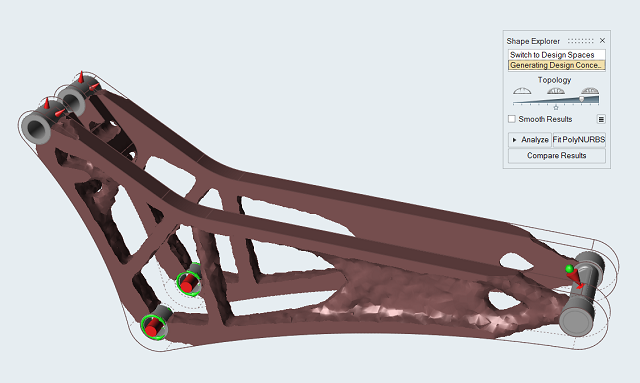
Smooth Results and Fit PolyNURBS
Select the Smooth Results option on the Shape Explorer.
(This setting may already be selected if you used it previously during the
session.)
Click the icon on the Shape Explorer.
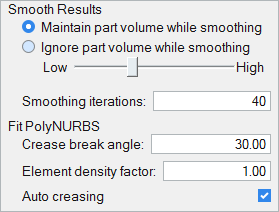
Experiment with the options on the dialog and see how this changes the
smoothness of the optimized result.
Drag the slider to the right to increase the smoothness.
Maintain part volume while smoothing is the
default option. Ignoring the part volume tends to provide even smoother
results, but material may appear thin or be removed entirely in some
regions.
Increasing the number of smoothing interations will also produce a
smoother result.
This dialog is also where you can adjust settings for fitting a polyNURBS to
the optimized result. Try using the default settings first.
Crease break angle is a threshold value. When
Auto creasing is enabled, any break angle above
the value entered will have high sharpening applied to the edge.
Lowering the Element density factor will increase
the size of the PolyNURBS cages, but will capture less detail. The default
value is 1. In general, you want to use the lowest density factor possible
that still captures the geometry.
Click in the modeling window to close the dialog.
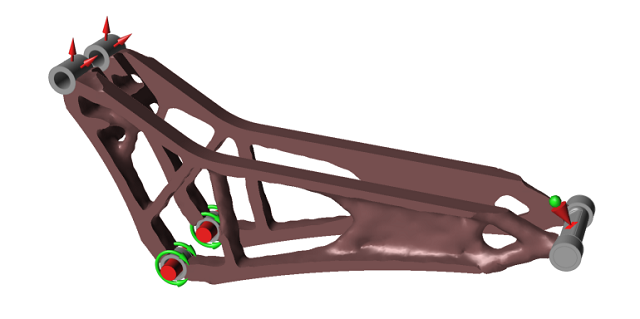
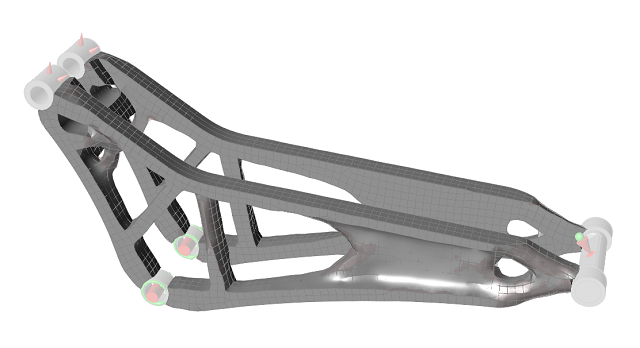
Click the Fit PolyNURBS button on the Shape Explorer.
This automatically generates a PolyNURBS and opens the PolyNURBS tool.
Double right-click to exit the PolyNURBS tool. This converts the PolyNURBS to a
CAD part, which appears as PolyNURBS Fit in the Model
Browser.
Eliminate Gaps Near Non-Design Spaces
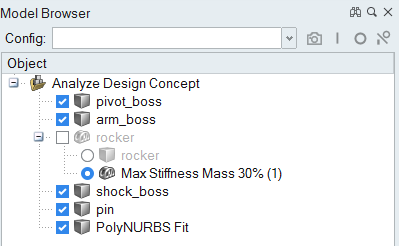
Press F5 to view the Model Configuration toolbar, which
appears at the top of the Model Browser.
Deselect the rocker check box to configure off the
initial part. This will exclude it from any calculations.
Double-right click in the modeling window to close the Model Configuration
toolbar.
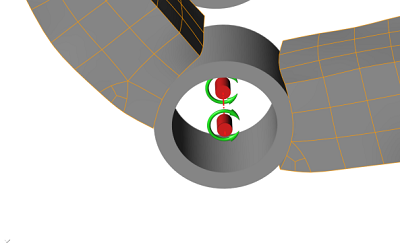
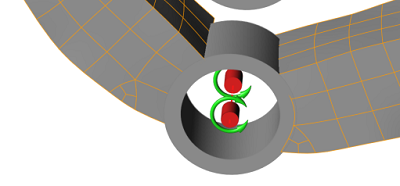
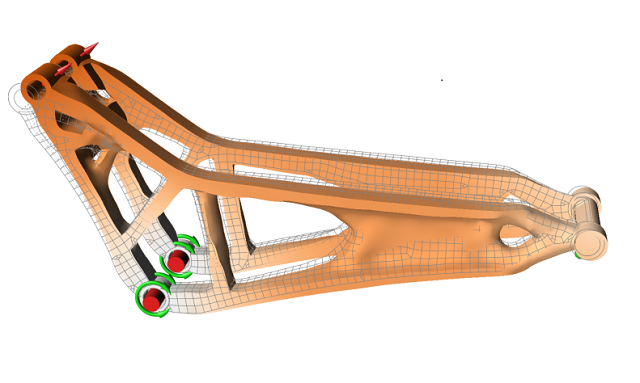
Use the scroll wheel to zoom in on the areas where the PolyNURBS contacts the
three boss parts. Notice that the PolyNURBS part has gaps near these non-design
spaces.
Use the Contacts tool on the Structure ribbon to locate
and review these gaps.
Fix these gaps using the various PolyNURBS tools on the Geometry ribbon so that
high stress concentration areas are not found in the subsequent analysis.
Analyze the Modified Shape
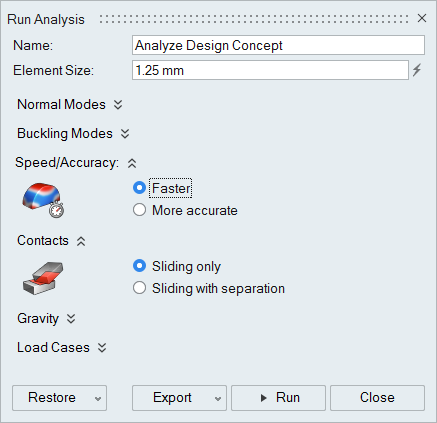
Click on the Analyze icon on the
Structure ribbon to analyze the modified shape.
Set the Speed/Accuracy setting to
Faster.
Click Run.
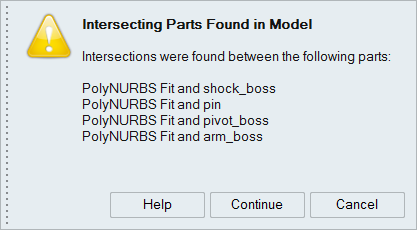
Depending on how well the cleanup went in he previous step, you may get
a warning message similar to the one below:
Click Continue.
A green check mark will appear when the analysis is complete. (This may
take several minutes.)
Double-click on the name of the run to view the results, which are displayed in
the Analysis Explorer.
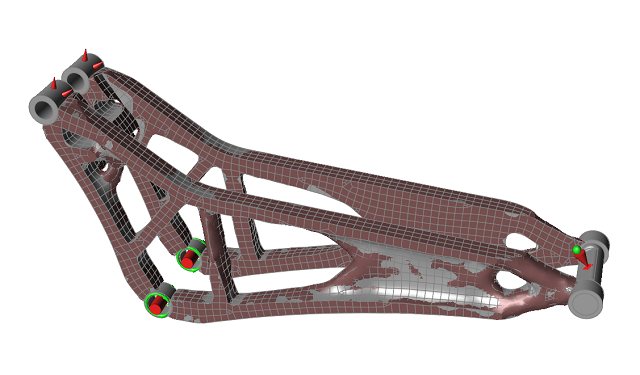
View the Analysis Results
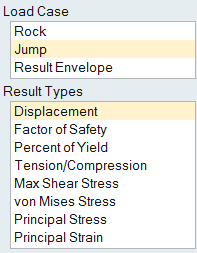
In the Analysis Explorer under Load Case, select the
Jump load case and the Displacement result
type.
The maximum displacement shown in the legend should be approximately .5 mm, but
your results will vary depending on where you positioned the topology slider and
how you modified the geometry near the non-design spaces.
Click the button under Animation to
view the displacement. Click the button again to stop the animation.
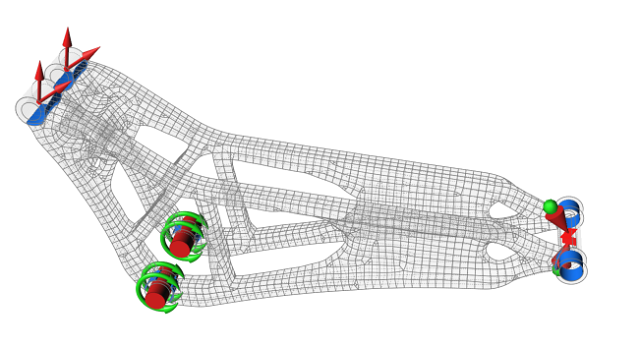
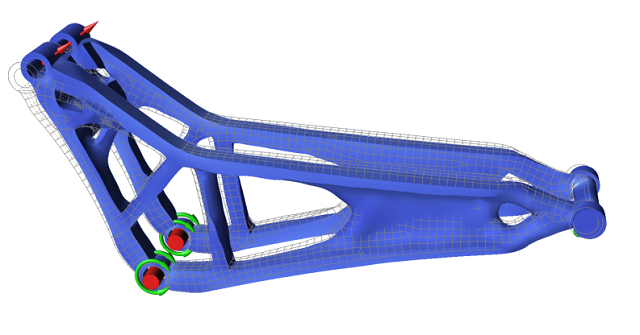
With the Jump load case still selected, switch to von Mises
Stress for the result type.
Click the icon and select Hide all loads and
supports.
Orbit the model to check that there are no hidden red areas.

 icon on the Shape Explorer.
 on the Analyze icon on the
Structure ribbon to analyze the modified shape.
on the Analyze icon on the
Structure ribbon to analyze the modified shape.

 button under Animation to
view the displacement. Click the button again to stop the animation.
button under Animation to
view the displacement. Click the button again to stop the animation.
 icon and select Hide all loads and
supports.
icon and select Hide all loads and
supports.