Select the run and load case for the tryout analysis, then view the
results.
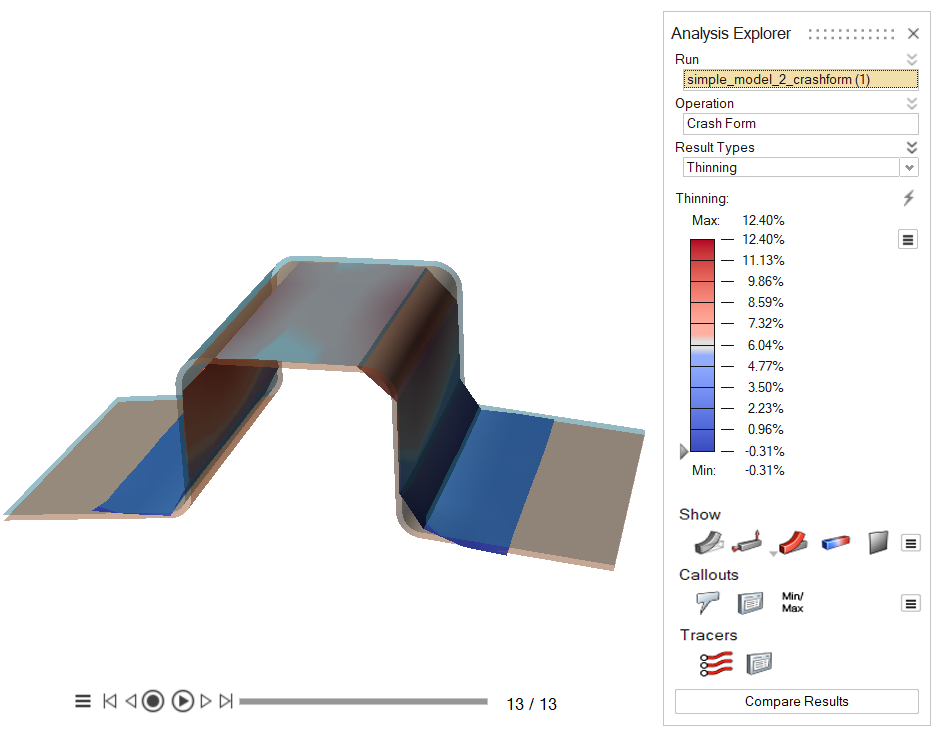
On the Tryout tab, Analyze icon, click Show Analysis
Results.
The Analysis Explorer dialog opens.
Tip: Use the
chevron next to each option to view all
options for runs, operations, and result types.
Select a run to analyze.
Select an operation.
Select a result type:
Result Type
Description
Thinning
Thinning is the ratio of the change in thickness to the original
thickness expressed as a percentage. A positive thinning percentage
indicates a reduction in thickness, which could be of concern for the
performance of the part under fatigue loading since thinner regions in
the part will undergo higher stresses compared to the rest of the part.
A negative thinning percentage indicates thickening of the part in
regions of compression. Excessive compression may lead to wrinkles on
the sheet metal, resulting in poor surface quality.
Thinning Delta
Thinning due to deformation in the current operation only, ignoring
history.
Major Strain
Major strain is the principal strain on the surface of the sheet
metal due to the deformation of the initial blank shape to the finished
product. The red areas indicate greater stretching relative to the blue
areas.
When you choose this option, a field appears for you to
view results based on a particular material surface. Under Result
Types, from the Major Strain dropdown, select a surface:
Lower, Upper, or
Membrane (middle).
By default, tensor
directional arrows are displayed. Toggle on and off in
Show>
Options.
Minor Strain
Minor strain is the principal strain on the surface of the sheet
metal due to the deformation of the initial blank shape to the finished
product. The red areas indicate less compression relative to the blue
areas.
When you choose this option, a field appears for you to view
results based on a particular material surface. Under Result Types,
from the Minor Strain dropdown, select a surface:
Lower, Upper, or
Membrane (middle).
By default,
tensor directional arrows are displayed. Toggle on and off in
Show>
Options.
Strain Tensor
View both major and minor strain tensors plotted together.
By
default, tensor directional arrows are displayed. Toggle on and off
in Show>
Options.
Curvature
Element curvature due to bending during forming. Includes principal
and local values.
Dominant Deformation
Indicates dominant deformation mode during forming. Ranges from 0 to
1, with 0 indicating stretching, and 1 indicating bending.
Equivalent Stress
Equivalent plastic stress is the stress on the surface of the sheet
due to the deformation of the initial blank shape to the finished
product. The red areas indicate more deformation relative to the blue
areas.
Formability
The principal strains on the surface of the sheet metal, also known
as Major and Minor strains, are plotted against a Forming Limit
Curve to identify different deformation zones that occur during the
stamping process. Each color indicates a unique deformation zone
during stamping.
Red: High potential for failure from
splitting due to excessive deformation.
Yellow: Marginal potential for failure.
View the percentage for Absolute and Relative.
Green: Safe with no potential for
failure.
Blue: Material is compressed.
Violet: Wrinkling zone with potential for
failure.
Cyan: Loose metal zone indicates that
material is not sufficiently deformed. View the percentage of
loose metal next to the color.
When you choose this option, a field appears for you to view results
based on a particular material surface. Under Result Types, from the
Formability dropdown, select a surface:
Lower, Upper, or
Membrane (middle).
Failure
Failure is estimated from the Forming Limit Diagram. The failure is
the relative distance of the major and minor strain at a point on the
Forming Limit Curve as shown in the example. A value less than one
indicates no failure and above one indicates failure.
When you choose this
option, a field appears for you to view results based on a
particular material surface. Under Result Types, from the Failure
dropdown, select a surface: Lower,
Upper, or Membrane
(middle).
Plastic Strain
The plastic strain of the sheet is the measurement of the
deformation from the initial blank shape to the finished product. The
red areas indicate there is more deformation relative to the blue areas.
When you choose this option, a field appears for you to view
results based on a particular material surface. Under Result Types,
from the Plastic Strain dropdown, select a surface:
Lower, Upper, or
Membrane (middle).
Plastic Strain Delta
Thinning due to deformation in the current operation only, ignoring
history.
Thickness
Thickness is the actual material thickness distribution in the part.
The thinning percentage is directly derived from the thickness
distribution.
Displacement
For a draw or crash form operation, displacement is the distance
that the flat blank moves from its initial shape to its final shape. For
a springback operation, displacement is the distance that the final
blank shape moves back toward its intial shape. Choose the
Magnitude, Global
X,Y,
Z, or +/-
Magnitude.
+/- Magnitude is available for the
springback operation only. Positive magnitude indicates displacement
along the normal direction; negative magnitude indicates
displacement in the opposite direction of the part
normal.
Skid Marks
Skid Marks indicates the likelihood of tool marks or skid lines. The
results range from zero, no chance, to one, very likely.
When you
choose this option, a field appears for you to view results based on
the impact of each tool. Under Result Types, from the Skid Marks
dropdown, select a tool: Top Die,
Bottom Die, or
Binder.
Figure 1. Thinning Results for a Crash Form Simulation
Enable the various Show options to
determine what is visible for the analysis.
Option
Description
Show/Hide Initial Shape
Show/hide the initial shape as a reference.
Show/Hide All Loads and
Supports
Show/hide loads and supports. You can also show only the
current loads and supports.
Show/Hide Deformed State
Show/hide the deformed shape as a reference.
Show/Hide Contours
Show/hide contours.
Show Thickened/Flat
Show the deformed sheet metal as a 3D solid or return it
to its flat state.
Options
Interpolate during animation:
Animate the result contour.
Blended contours: Toggle
between blended and nonblended contours.
Element contour: Show
contours based on elements rather than nodes. This
option is only avaialble for results types that are
based on elements.
Vector plot: Display the
direction vectors for the displacement result
type.
Tensor plot: Display
directional arrows for the strain tensor.
Enable various Callout options to show analysis results
at a point of interest on your model. The callout values apply to the currently
selected run and load case.
Use the Tracer to track how a line moves from one step
to another. For more information, see Trace on a Tryout Analysis.
View and record the animation of the forming results with the Animation toolbar
that is located at the bottom of the modeling window:
Tip:
Change the legend colors for each result type in the Preferences dialog by clicking > Legend Colors.
To filter the results so that areas on the model with results greater than a
specified value are masked, click and drag the arrow on the results slider.
To mask areas with results less than the specified value, click and select Flip Mask.
Select the arrow to enter a specific value.
Restore the result slider's default values by clicking .
Select Export Blank from the context menu to export
the blank as displayed. If you have defined a reference system, it will be
exported in the new position not in the global system.
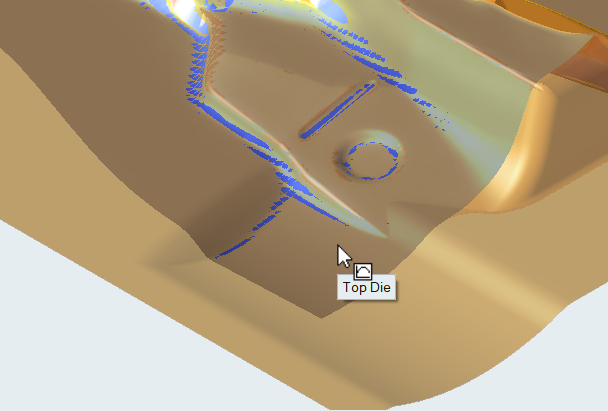
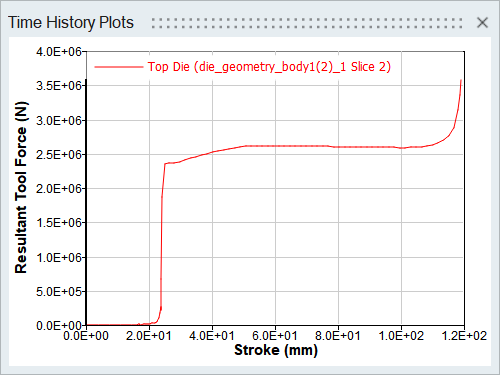
View Time History Plots
Click on a tool to open the Time History Plots for that
tool.
Note: Press Ctrl and click multiple tools to plot their tool forces in the same
window.
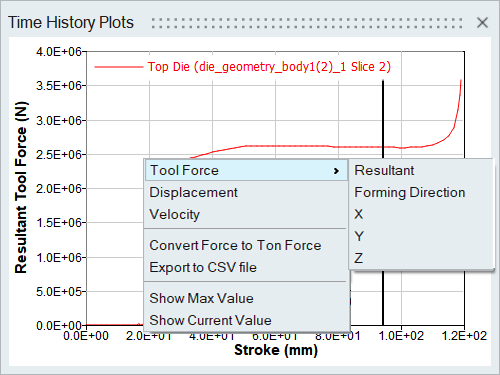
Right-click in the plot to change the y-axis, convert the force units, export
to CSV file, or add a callout for the maximum or current value.
By default, Resultant Tool Force is shown on the
y-axis.
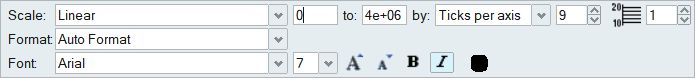
Right-click on an axis to change attributes like Scale
and Format.
You can interact and manipulate the plot using the following methods:
Ctrl + Mouse over the curve: Examine values in the plot.
Ctrl + Mouse left button dragging: Pan the plot.
Mouse wheel rolling up/down: Zoom in/out on the plot.
If the mouse is on the X (resp. Y) axis, it will only zoom on
the X (resp. Y) axis.

 next to each option to view all
options for runs, operations, and result types.
next to each option to view all
options for runs, operations, and result types. 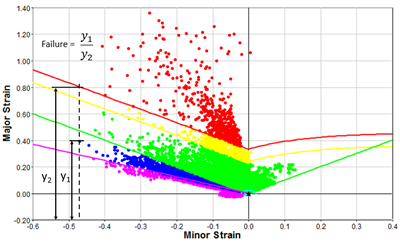


 > Legend Colors.
 .
.