legend
Update axes' legend text, turn on/off the legend of axes. Toggle the states if no argument is used.
Syntax
legend()
legend('on')
legend('off')
legend(str1, str2, ...)
legend(str-cell)
legend(h-vector, str-cell)
legend(..., property, value)
Inputs
- on/off
- Determines whether legend is set to on or off.
- str1, str2
- Legend text. str1 is the text for the first curve, str2 is the text for the second curve, etc.
- str-cell
- Legend text in a cell array.
- h-vector
- Handles of the curves which show legends.
- property, value
-
- 'location'
- Specifies the location of the legend.
Example
Simple legend
example.
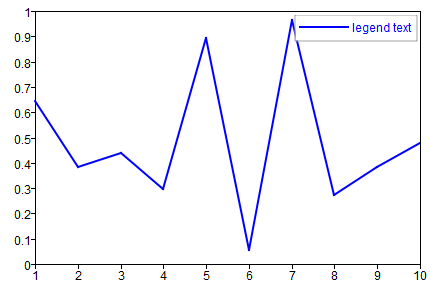
Figure 1. Legend Example 1
clf;
plot(rand(1, 10));
legend('on');
legend('legend text');
Figure 1. Legend Example 1
Add legends for selected
curves.
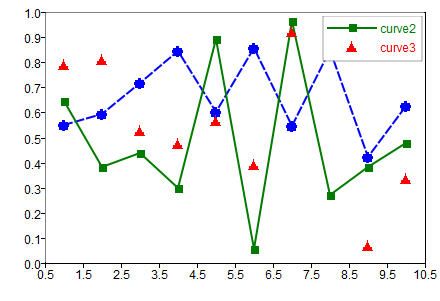
Figure 2. Legend Example 2
clf;
hold on;
h1 = plot(rand(10,1),'--o');
h2 = plot(rand(10,1),'-s');
h3 = plot(rand(10,1),'r^');
legend([h2,h3],{'curve2','curve3'});
Figure 2. Legend Example 2
Set the location of the
legend.
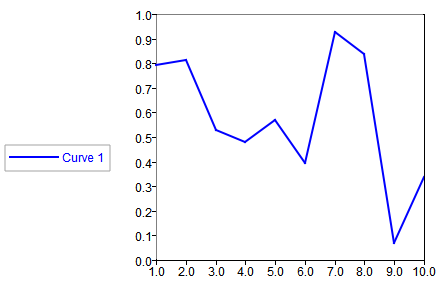
Figure 3. Location string example
clf;
plot(rand(1, 10));
legend('location','westoutside');
Figure 3. Location string example
Set legend location
coordinates.
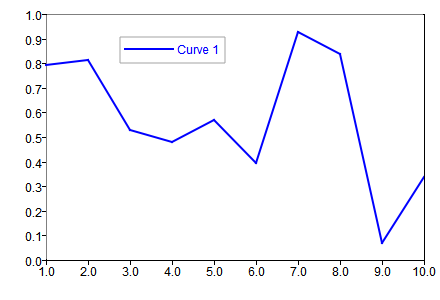
Figure 4. Location coordinates example
clf;
plot(rand(1, 10));
legend('location',[0.2 0.1]]);
Figure 4. Location coordinates example