HWD-0091: Create Presentation Report

In this tutorial, you will learn how to create, execute, and export PowerPoint report using loop results and entity overview modules.

The files used in this tutorial are located here:

<installation_directory>/tutorials/hwdesktop/mv_hv_hg/publish_reports/

Before you begin, please make sure that you are using HyperWorks Desktop 2019.1.2 or above.

Create a Presentation Report

In this exercise, you will: create a Presentation report tree using slide layouts, existing slides, and modules; execute the report items; and export the Presentation report.

Before you begin, copy Report_Tutorial_Session.mvw from the publish_reports folder to your working directory.

Launch the Report

In this step, you will launch the report in HyperWorks Desktop.

  1. From the menu bar, select Report.
  2. Click from the Report Ribbon.
  3. From the menu bar, select File > Open > Session
    The Open Session File dialog opens.
  4. Browse and select the Report_Tutorial_Session.mvw file.
    The file opens in the graphics window.
  5. Open the Presentation master file.
    1. From File menu, click Preferences.
    2. Select Report from Common section.
    3. Select the Default Report Type as Presentation.
    4. In Master Document section, for Presentation, browse and select the pptMaster.pptx file.

Create a Report Tree

In this step, you will create a report tree using Presentation report items.


  1. From the Report ribbon, click and select the layout option.
  2. Select One Image with Caption.
    A new slide is added to the report tree under Report.
  3. Name the slide Introduction.
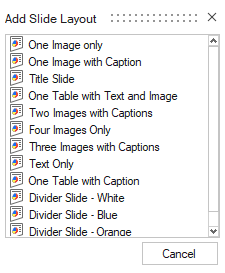
  4. Using the Entity Editor, define the text entity properties.
    1. Under Introduction, select the text entity.
      The Entity Editor opens for the text entity.
    2. Click Text and select .
      The Define Text dialog opens.
    3. Enter This is a wing model analysis report. in the dialog.
    4. Click OK to close the dialog.
  5. Preview the text entity.
    1. Click to preview the text entity.
      The Define Text dialog opens and displays the content of the entity.
    2. Click Cancel to close the preview.
  6. Using the Entity Editor, define the image entity properties.
    1. Under Introduction, select the image entity.
      The Entity Editor opens for the image entity.
    2. Name the image entity Figure 1 - Wing Model.
    3. Set Source to Graphics Area.
    4. Set Model to Page 1/Window 1.
  7. Select Figure 1 - Wing Model and click Run.
    The image entity is executed, captured from the HyperWorks Desktop window, and updated.
  8. Preview the image entity by repeating step 5.

Export the Report

In this step, you will export the report.

  1. In the Report browser, select Report and then click in the Report toolbar.
    A file browser window opens.
  2. Browse and select the required destination folder.
  3. Enter Model Overview Report - PPT for the report title.
  4. Click Save
    The Presentation report and the report template (.tpl) are saved.

Create the Assembly Overview Module

In this step, you will create an Assembly Overview module.

  1. In the Report browser, select Report and clickAdd Modules > Model Info > Entity Overview from the Report ribbon.
    An Entity Overview module is added to the report tree under Report.
  2. Using the Entity Editor, define the Entity Overview module properties.
    1. Name the module Level 2 Assembly Overview.
    2. Set Model to Page 2/Window 1.
    3. Set the Entity Type to Assemblies.
    4. Set the Assembly Level to 2.
    5. Set the Layout option to One Image with Caption.
  3. Select Level 2 Assembly Overview module and click Run.
    The Assembly Overview - HyperView - Model Overview dialog opens.
  4. Verify that notes were created in the graphics area and click Capture Image in the Assembly Overview - HyperView - Model Overview dialog.
    The image is captured with notes and an image output is added to the report tree.
  5. Click to close the Assembly Overview - HyperView - Model Overview dialog.
    Tip: You can view the image output using the Preview option.
  6. Repeat steps 1 through 5 to capture and execute an Entity Overview module named Level 3 Assembly.
    The image is captured with notes and an image output is added to the report tree as seen in Figure 1.
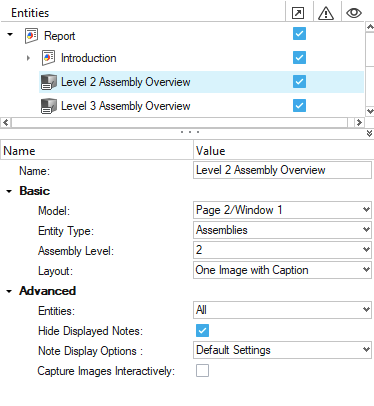

    Figure 1.

Create the Property Overview and Model Statistics Modules

In this step, you will create the Model Overview and the Properties Overview modules.

  1. In the Report browser, select Report and clickAdd Modules > Model Info > Entity Overview from the Report ribbon.
    An Entity Overview module is added to the report tree under Report.
  2. Using the Entity Editor, define the Entity Overview module properties.
    1. Name the module Property Overview.
    2. Set Model to Page 2/Window 1.
    3. Set the Entity Type to Properties.
  3. Select Property Overview module and click Run.
    The Property Overview - HyperView - Model Overview dialog opens.
  4. Verify that notes were created in the graphics area and click Capture Image in the Property Overview - HyperView - Model Overview dialog.
    The image is captured with notes and an image output is added to the report tree as seen in Figure 2.
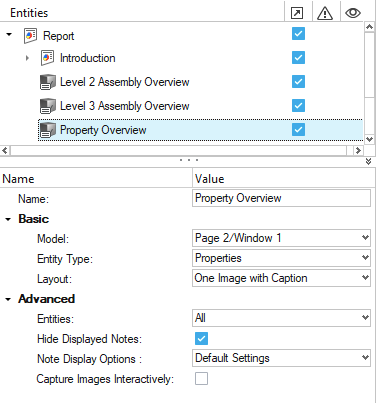

    Figure 2.
  5. Click to close the Property Overview - HyperView - Model Overview dialog.
    Tip: You can view the image output using the Preview option.
  6. In the Report browser, select Report and clickAdd Modules > Model Info > Model Statistics from the Report ribbon.
    A Model Statistics module is added to the report tree under Report.
  7. In the Entity Editor, set Model to Page 2/Window 1.
  8. Right-click on the Model Statistics module and select Run.
    Tip: You can preview the model statistics data using the Preview option.
    The model statistics data is added to the report tree under Model Statistics as seen in Figure 3.
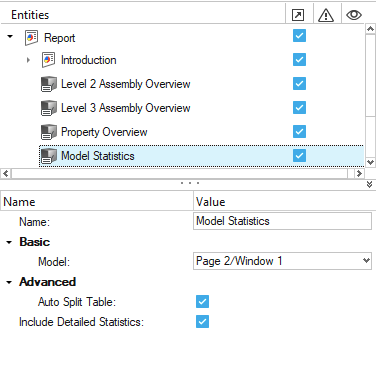

    Figure 3.

Create the Applied Forces and Displacements Results Loop Module

In this step, you will create a Loop Results module named Applied Forces and Displacement Results Loop.

  1. In the Report browser, select Report and clickAdd Modules > Results > Loop Results from the Report ribbon.
    A Loop Results module is added to the report tree under Report.
  2. Using the Entity Editor, define the Loop Results module properties.
    1. Name the module Applied Forces and Displacement Results Loop.
    2. Set the Model option to Page 3/Window 1.
    3. Click Components and click .
      The component selector panel opens.
    4. Click in the component selector panel to reset the components.
    5. Click the component selector.
      The Extended Entity Selection dialog opens.
    6. Select By ID.
    7. In the Components entry field, enter 2, 70, 71, 73, 74, 97 and click Add.
      The component IDs are listed in the Components entry field.
    8. Click Return to close the Extended Entity Selection dialog.
    9. Click proceed in the component selector panel to exit the panel.
    10. Click Load Cases and click .
      The Select Load Cases dialog opens.
    11. Select the loadcases listed in the panel and click OK.
  3. Select Applied Forces and Displacement Results Loop and click .
  4. Select Two Images with Captions.
    A slide layout is added to the report tree under the Applied Forces and Displacement Results Loop. The slide layout includes the title of the module, two images, and two captions.
  5. Using the Entity Editor, define the first image entity properties.
    1. Rename the first image entity Applied Forces.
    2. Set Model to Page 3/ Window 1.
    3. Set the Output Type to Animated GIF.
  6. Using the Entity Editor, define the second image entity properties.
    1. Rename the image entity Displacement Results.
    2. Set Model to Page 3/ Window 2.
    3. Set the Output Type to Animated GIF.
  7. Using the Entity Editor, update the first text entity.
    1. Rename the first caption Applied Forces Caption.
    2. Click Text and select .
      The Define Text dialog opens.
    3. Enter This is the Applied Forces Image..
    4. Click OK to close the dialog.
  8. Using the Entity Editor, update the second text entity.
    1. Rename the second caption Displacement Results.
    2. Repeat step 7.b.
    3. Enter This is the Displacement Results Image..
    4. Repeat step 7.d.
  9. Select Applied Forces and Displacement Results Loop module and click Run.
    Note: The execution process may take several minutes.
    Tip: You can view the images and results table using the Preview option.
    The required images and results table are added to the report tree under Applied Forces and Displacement Results Loop as seen in Figure 4.
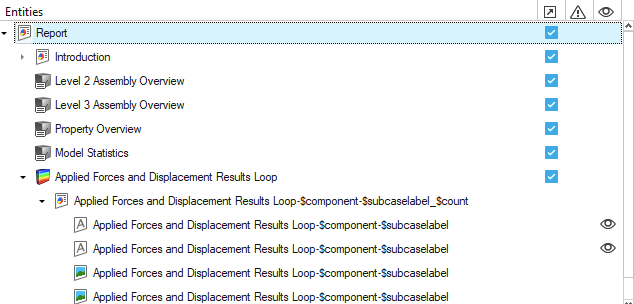

    Figure 4.

Create the Composite Stress Results Loop Module

In this step, you will create a Loops Results module named Composite Stress Results Loop.

  1. SelectReport and click Add Modules > Results > Loop Results.
    A Loop Results module is added to the report tree under Report.
  2. Using the Entity Editor, define the Loop Results module properties.
    1. Name the module Composite Stress Results Loop.
    2. Set Model to Page 4/Window 1.
    3. Click Components and click .
      The component selector guide bar opens.
    4. Select By ID.
    5. In the Components entry field, enter 2, 70, 97, 98 and click Add.
      The component IDs are listed in the Components entry field.
    6. Click Return to close the Extended Entity Selection dialog.
    7. Click proceed in the component selector panel to exit the panel.
    8. Click Load Cases in Property Editor and select multiple.
      The Select Load Cases dialog opens.
    9. Select the loadcases listed in the panel and click OK.
  3. Select Composite Stress Results Loop module and click .
  4. Select One Image with Caption.
    A slide layout is added to the report tree under Composite Stress Results Loop. The slide layout includes the module title, one image, and one caption.
  5. Using the Entity Editor, define the image entity properties.
    1. Set Model to Page 4/ Window 1.
    2. Set the Note Location to HotSpots of Contour.
      Additional options activate.
    3. Maintain the default values for the the following properties:
      • Find Hotspots
      • Thresholds
      • Tolerance
      • Maximum Hotspots
    4. Under Advanced, click Thresholds > Define.
      The Define Threshold dialog opens.
    5. Retain the default Fail and Warn Limit values.
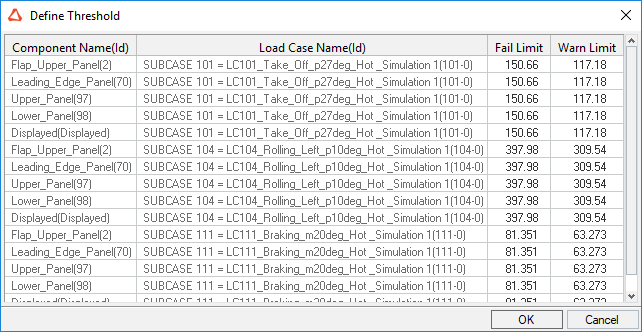

      Figure 5.
    6. Click OK to confirm the values and complete the thresholds definition.
      The Thresholds field is assigned with a green check mark as seen in Figure 6.
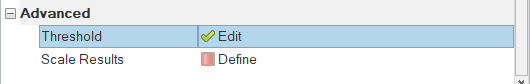

      Figure 6.
  6. Right-click on the Composite Stress Results Loop module and select Run.
    Note: The execution process may take several minutes.
    Tip: You can view the images and results table using the Preview option.
    The required images and results table are added to the report tree under Composite Stress Results Loop.

Export the Report

In this step, you will export the report.

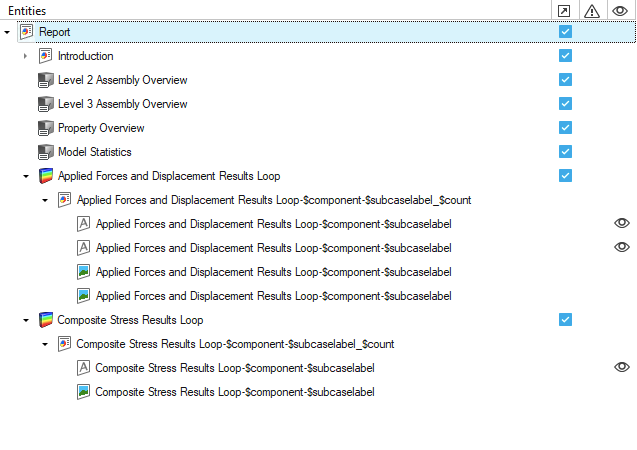
  1. Right-click at Report level and click Expand All.
    This expands all child levels in the report tree. The tree structure provides the insight of the report Table of Contents that will be exported as a Presentation report.
  2. In the Report browser, select Report and then click in the Report toolbar.
    A file browser window opens.
  3. Browse and select the required destination folder.
  4. Enter WingFrame_PPTReport as the report title.
  5. Click Save.
    A working window opens while saving the Presentation report. A Presentation report and report template (.tpl) are saved. The PowerPoint file opens automatically. The content is added to the report in a live session.