Modal Contributions Tutorial
Below are the steps to study the Modal Contributions for the tutorial model
-
From the Rattle Analysis - Tutorial_IP_SNR_Model.fem
page, you can observe that the relative displacement is highest for
19488009interface where relative displacement values are reaching2.73mm.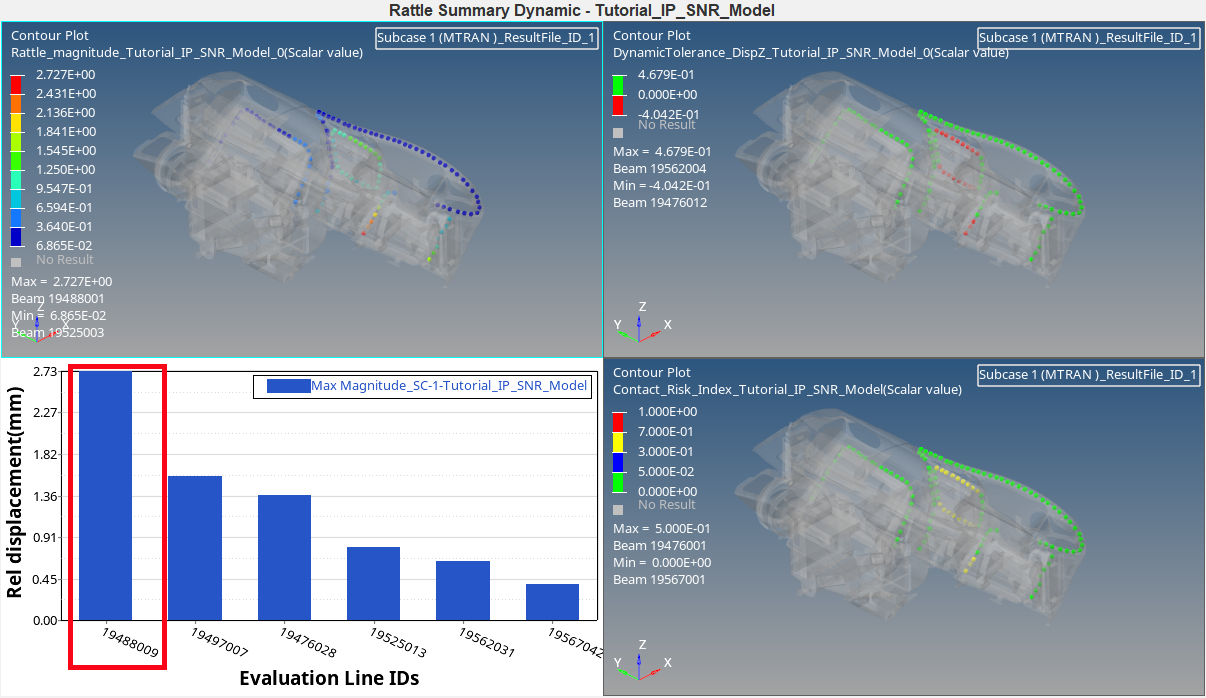
Figure 1. -
Click Load Time History
 SnRD will display a Working Status window that indicates the results are being queried and plotted.
 Upon completion of this step, the Relative Displacement vs Time curve is plotted in the HyperGraph window.
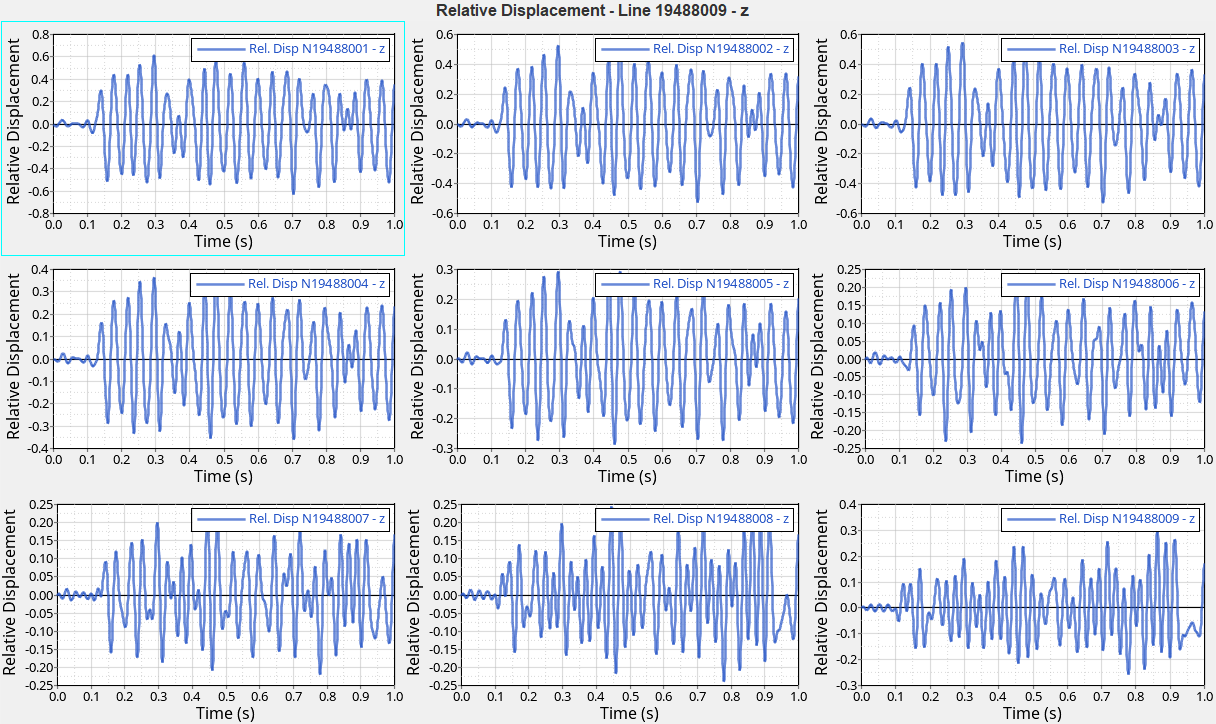
Figure 2.
To perform RMC Calculation
-
Select
5from Select Top Contributors drop down list and click Analyze .
The inputs should be as shown below.
.
The inputs should be as shown below.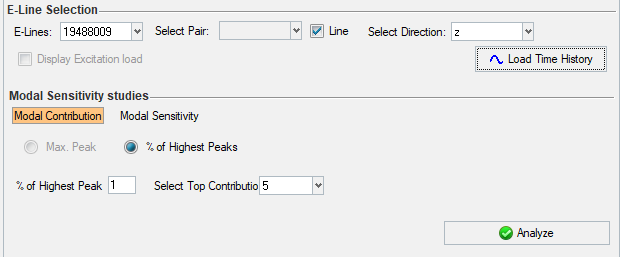
Figure 3.The RMC calculation is performed behind the scene in SnRD and a bar chart showing the percentage of contribution for each mode is shown in the graphics area. The modes are ranked from the most contributing to the least contributing one. This plot gives a clear indication of the mode that contributes the most to squeak or rattle disturbance. The modes that contribute the most are those that must be chosen for further study in the Modal Sensitivity analysis step.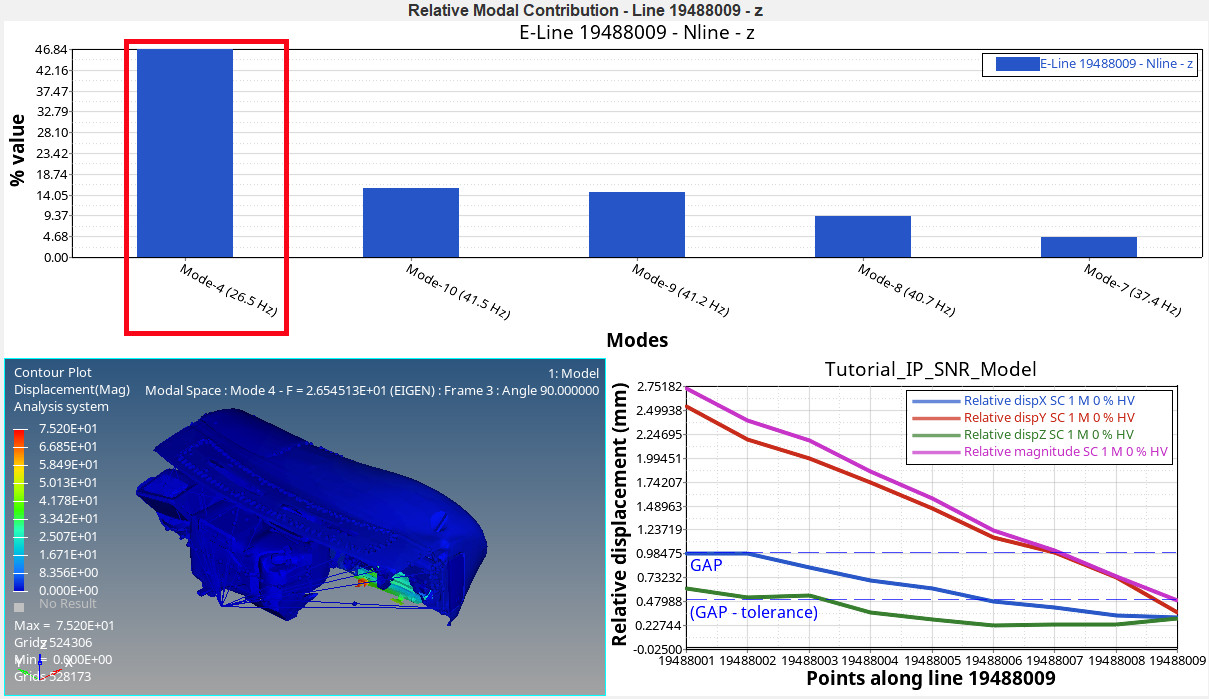
Figure 4.