Sensitivity Analysis
- Determination of Relative Modal Contribution to squeak and rattle of complete E-Lines and as well as at specific points on each E-Line
- Capability to check the effect of changing the percentage of modal contribution on the squeak and rattle performance

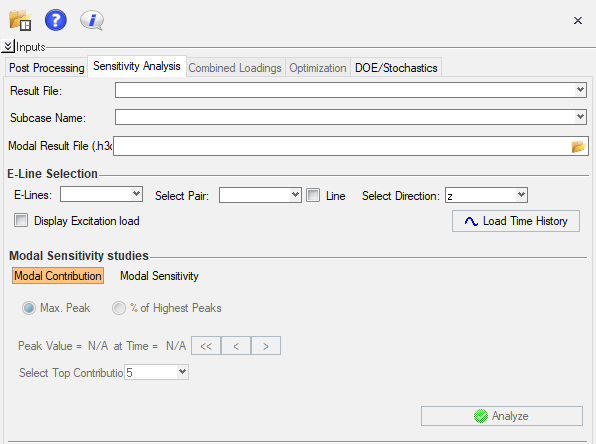
Figure 1.
- Result File - drop down list to select the results file loaded in the SnRD Main Tab
- Subcase Name - drop down list to select the subcase associated with the selected Result File
- Modal Result File (h3d) - to select a
H3Dfile containing the modal contribution results. - Calculation Type - The sensitivity analysis is a two step process.
- The first step is to calculate the Relative Modal Contribution of the required E-Line to be analyzed.
- The second step is to observe the change in results when the modal
contribution is varied but either including a certain mode or
excluding it from result calculations with the help of
Modal Sensitivity study. The relative
modal contribution for a particular E-Line can be calculated and
studied in two ways:
- Study the modal contribution of the complete E-Line
- Study the modal contribution of a particular node pair of an E-Line