After execting the results post processing, the next step is to study the risks of the
squeak and rattle issues. You can perform following operations in the
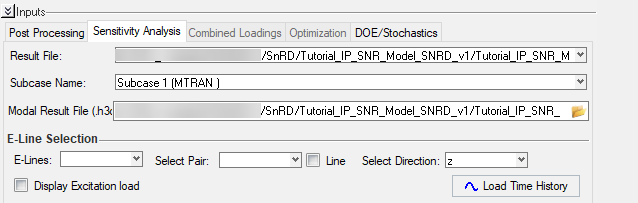
Relative Modal Contribution panel - Figure 1.
E-Line Selection -
E-Lines - drop down list to select Elines in the
model
Select Pair - drop down list to select the
respective pair, a node on the line or complete line
Select Direction - drop down list to select the
plotting direction for displacement.
Note: By default z
direction will be selected, since the assumption is the relative
displacement will occur and captured in z
direction.
Display Excitation Load - check box option to
view the loading strength plotted in a HyperGraph window. This loading
strength value is taken from Load Creation
Load Time History - to generate and plot loading
time history and relative displacement plots for the selected Eline and
the pair.
Note: Once the time history is loaded in the session, the next
step would be to study the relative modal contributions.
RMC Calculation -
Max Peak - option is enabled only when you are
studying modal contributions based on nodes as the selected pair.
Peak - Value & Time - The plot
highlights the peaks values in relative displacement using
horizontal and vertical dashed lines and also shows labels to
highlight the same.
% of Highest Peaks - option is enabled only when
you are studying modal contributions based on complete ELine as the
selected pair
Enter the percentage value of peaks that you want to study in
the % of Highest Peaks field
Select Top Contributors - option to
select the number of top modes contributing to be plotted and
displayed as bar graphs in descending order of effect.