Viewing the Results
View and post-process the results in POSTFEKO.
-
Compare the far field pattern of the finite antenna array with the equivalent
full MoM model.
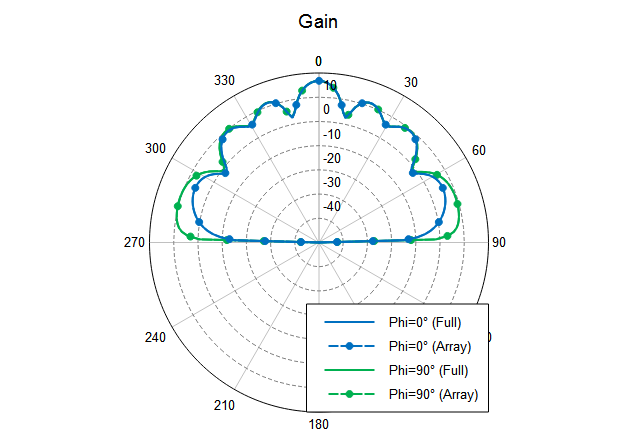
Figure 1. A polar plot of the far field gain (dB) viewed in POSTFEKO. The gain of the finite antenna array is compared to the equivalent full MoM model.
Note: The finite array tool simplifies array construction. For larger arrays, the
performance improvement of the DGFM are more pronounced.