View Radial Points
This option is available when observation spheres have been set. This plot is used to represent the different values for the Near Field on each radius sample defined in a sphere. Therefore, to make this plot useful, it is suggested to generate an observation sphere that makes use of multiple radius using samples.
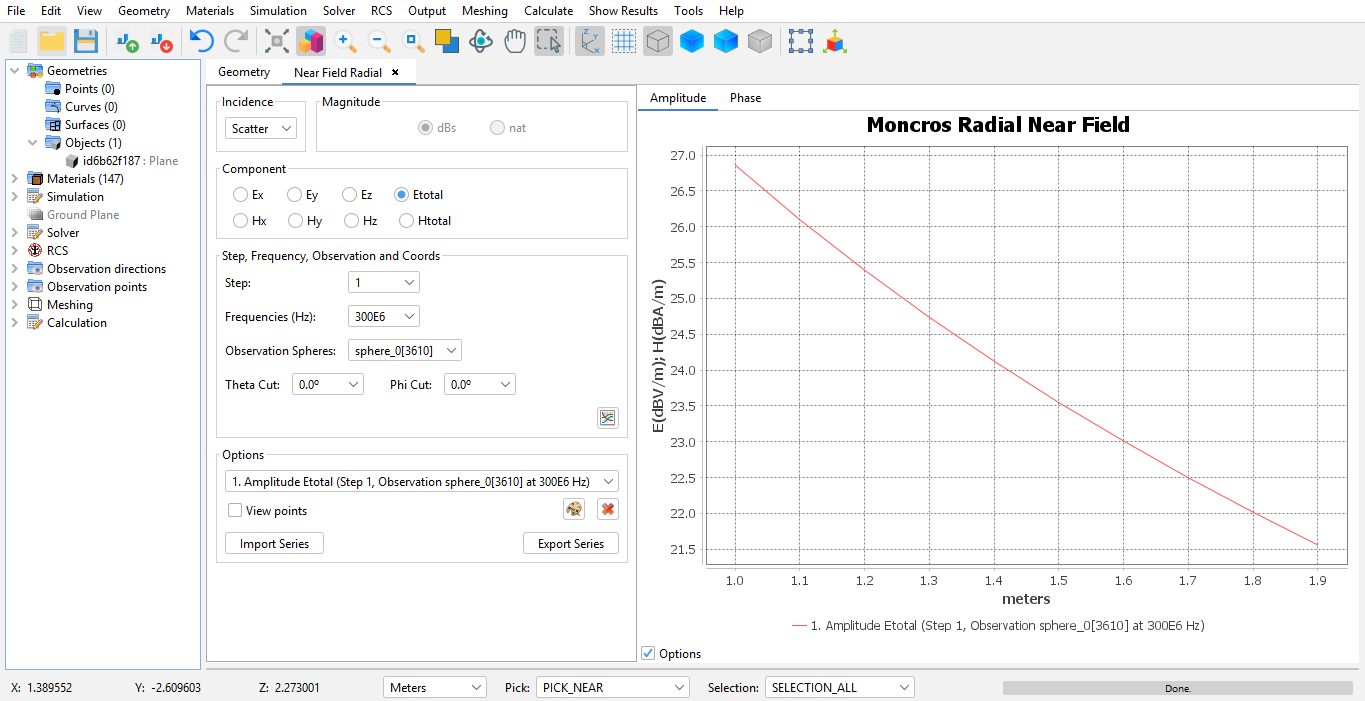
Figure 1. Radial Near Field
When this option is selected, the panel previously depicted is shown. The following options are available to the left.
- Incidence
- which kind of near field incidence to add scatter incidence, direct incidence or total incidence.
- Component
- which field component to inspect, from either the E-field or the H-field, and whether to inspect the X, Y or Z component or the total field.
- Step
- on simulation projects that make use of step, the user can select the step number to add.
- Frequencies
- on simulation projects that make use of multiple frequencies, the user can select one particular frequency to add.
- Observation points
- on simulation projects that make use of multiple observation point structures, the user can select one of the geometries
- Theta and phi cuts
- when multiple observation directions are available, this option is used to select one particular cut.
Press the Add Series button to add the series to the graph.
It is possible to modify already existing series too. The user can set the color for the series, which is useful when multiple series have been added to the plot. Select the series using the List of series control, and press Change colors to modify the color used to render the series. Additionally, a series can be removed if it's not relevant anymore to the purpose of the plot.
It is also possible to export already existing series and import series previously imported, which is useful for comparing series made using different projects or simulations.