View Observation Points By Step
This option lets the user analyze the values for the near field through multiple steps. To make this section useful, at least two steps must exist in the project. The user can use this result view to generate plots that compare the values at near field for a particular Observation point given component, incidence and frequency through every step.
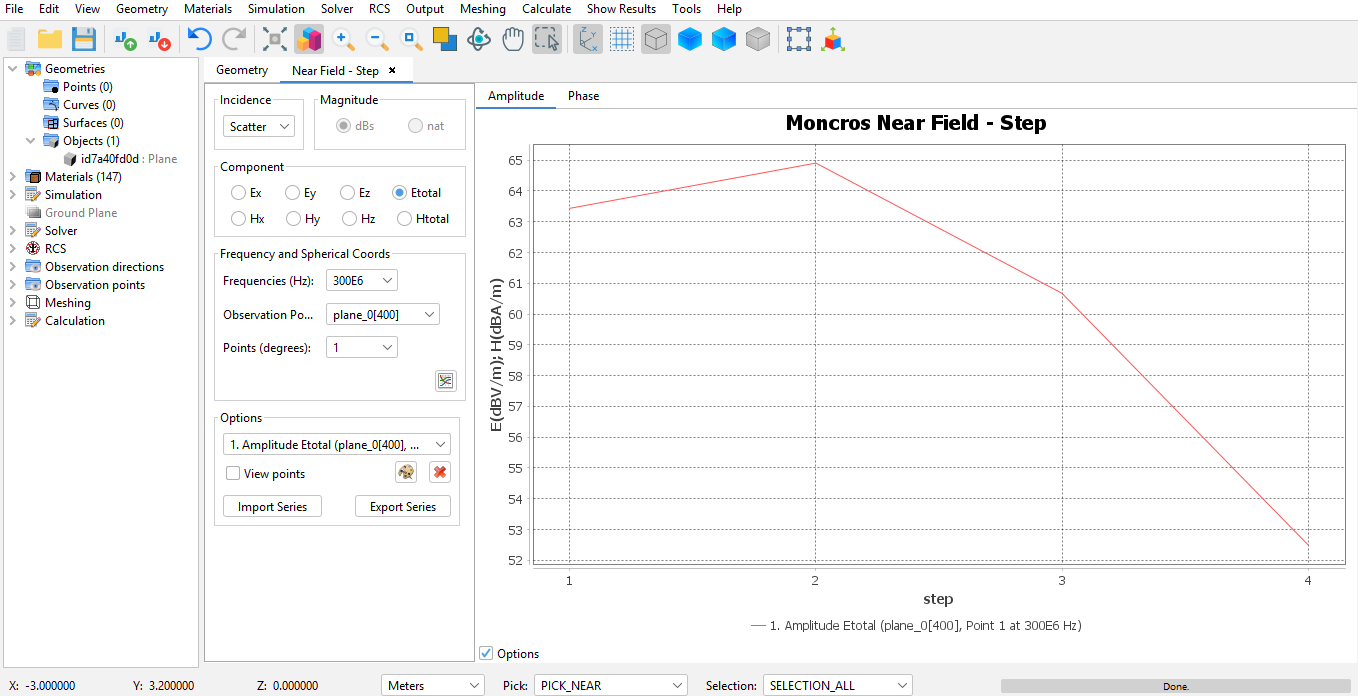
Figure 1. Near Field - Step
The controls on the left let the user add, modify and delete series. Using the visible controls the user can select a series to add using the following settings:
- Incidence
- which kind of near field incidence to add scatter incidence, direct incidence or total incidence.
- Field Component
- which field component to inspect, from either the E-field or the H-field, and whether to inspect the X, Y or Z component or the total field.
- Frequencies
- on simulation projects that make use of multiple frequencies, the user can select one particular frequency to add.
- Observation points
- on simulation projects that make use of multiple observation point structures, the user can select one of the geometries.
- Observation Point
- the user can select a particular observation point from the list.
Press the Add Series button to add the series to the graph.
It is possible to modify already existing series too. The user can set the color for the series, which is useful when multiple series have been added to the plot. Select the series using the List of series control, and press Change colors to modify the color used to render the series. Additionally, a series can be removed if it's not relevant anymore to the purpose of the plot.
It is also possible to export already existing series and import series previously imported, which is useful for comparing series made using different projects or simulations.